U.S. Review December 2025: Year-End Insights and 2025 Overview
Published: January 21, 2026

Bram Gallagher
Key Takeaways:
- National occupancy ended 2025 broadly flat, but market and operator performance diverged sharply across locations and price tiers.
- Pricing momentum improved late in the year, driven by stronger upscale demand and continued premium positioning by new entrants.
- Early pacing data points to firmer demand conditions in spring and summer 2026, supported by stabilizing lead times.
December closed out a year of mixed performance for the U.S. short-term rental market. While headline occupancy finished broadly in line with 2024, underlying trends point to a market shaped by widening performance gaps across locations, price tiers, and operators.
Modest demand growth, stabilizing lead times, and renewed pricing momentum late in the year offer cautious optimism heading into 2026, even as inflation and uneven consumer confidence continue to influence travel behaviour.
At a Glance: Key U.S. STR Performance Metrics for December 2025
- Revenue per Available Rental (RevPAR) increased 1.8% year-over-year (YoY) to $126.97
- Available listings reached 1.66 million, a 3.4% increase YoY
- Demand nights were up 1.9% in December
- Occupancy averaged 51.0%, down -1.7% YoY
- Average Daily Rates (ADR) climbed to $248.57, up 3.3% from last year
- The Repeat Rent Index (RRI) rose 2.5% YoY
- Total nights booked were up 4.1% from December 2024
Economic Outlook
The Trump Administration escalated its criticism of Federal Reserve Chair Jerome Powell in December, including threats of legal action that Powell dismissed as politically motivated. The rhetoric followed new data from the Bureau of Labor Statistics showing that year-over-year inflation remained elevated at 2.7%. Price pressures were especially pronounced in food and electricity, giving the Federal Reserve reason to pause its recent rate-cutting cycle.
Additional support for holding rates steady came from the labor market. Unemployment edged down to 4.4% in December from 4.5% in November. While job growth was weaker than expected, with only 50,000 jobs added, and labor force participation slipped slightly to 62.4%, employment conditions remain broadly stable. With inflation still running above long-term targets, the Fed appears more concerned with price stability than stimulating additional job growth, despite ongoing pressure from the Trump Administration to lower interest rates.
In a surprise move, the Administration also directed government-sponsored enterprises Freddie Mac and Fannie Mae to purchase $200 billion in mortgage-backed securities. This policy, effectively a targeted form of quantitative easing, briefly pushed mortgage rates below 6%. Prior to this announcement, Oxford Economics had forecast mortgage rates would remain above 6% through 2027 in the absence of new policy interventions.
Mortgage rates had already been trending downward following several interest rate cuts by the Federal Reserve in the latter half of the year, and AirDNA expects these lower rates to contribute to renewed supply growth in 2026. While the latest intervention may provide a modest additional tailwind, mortgage rates have since stabilized back above the 6% threshold.
Supply Growth Is Muted But Elevated from Summer Lows
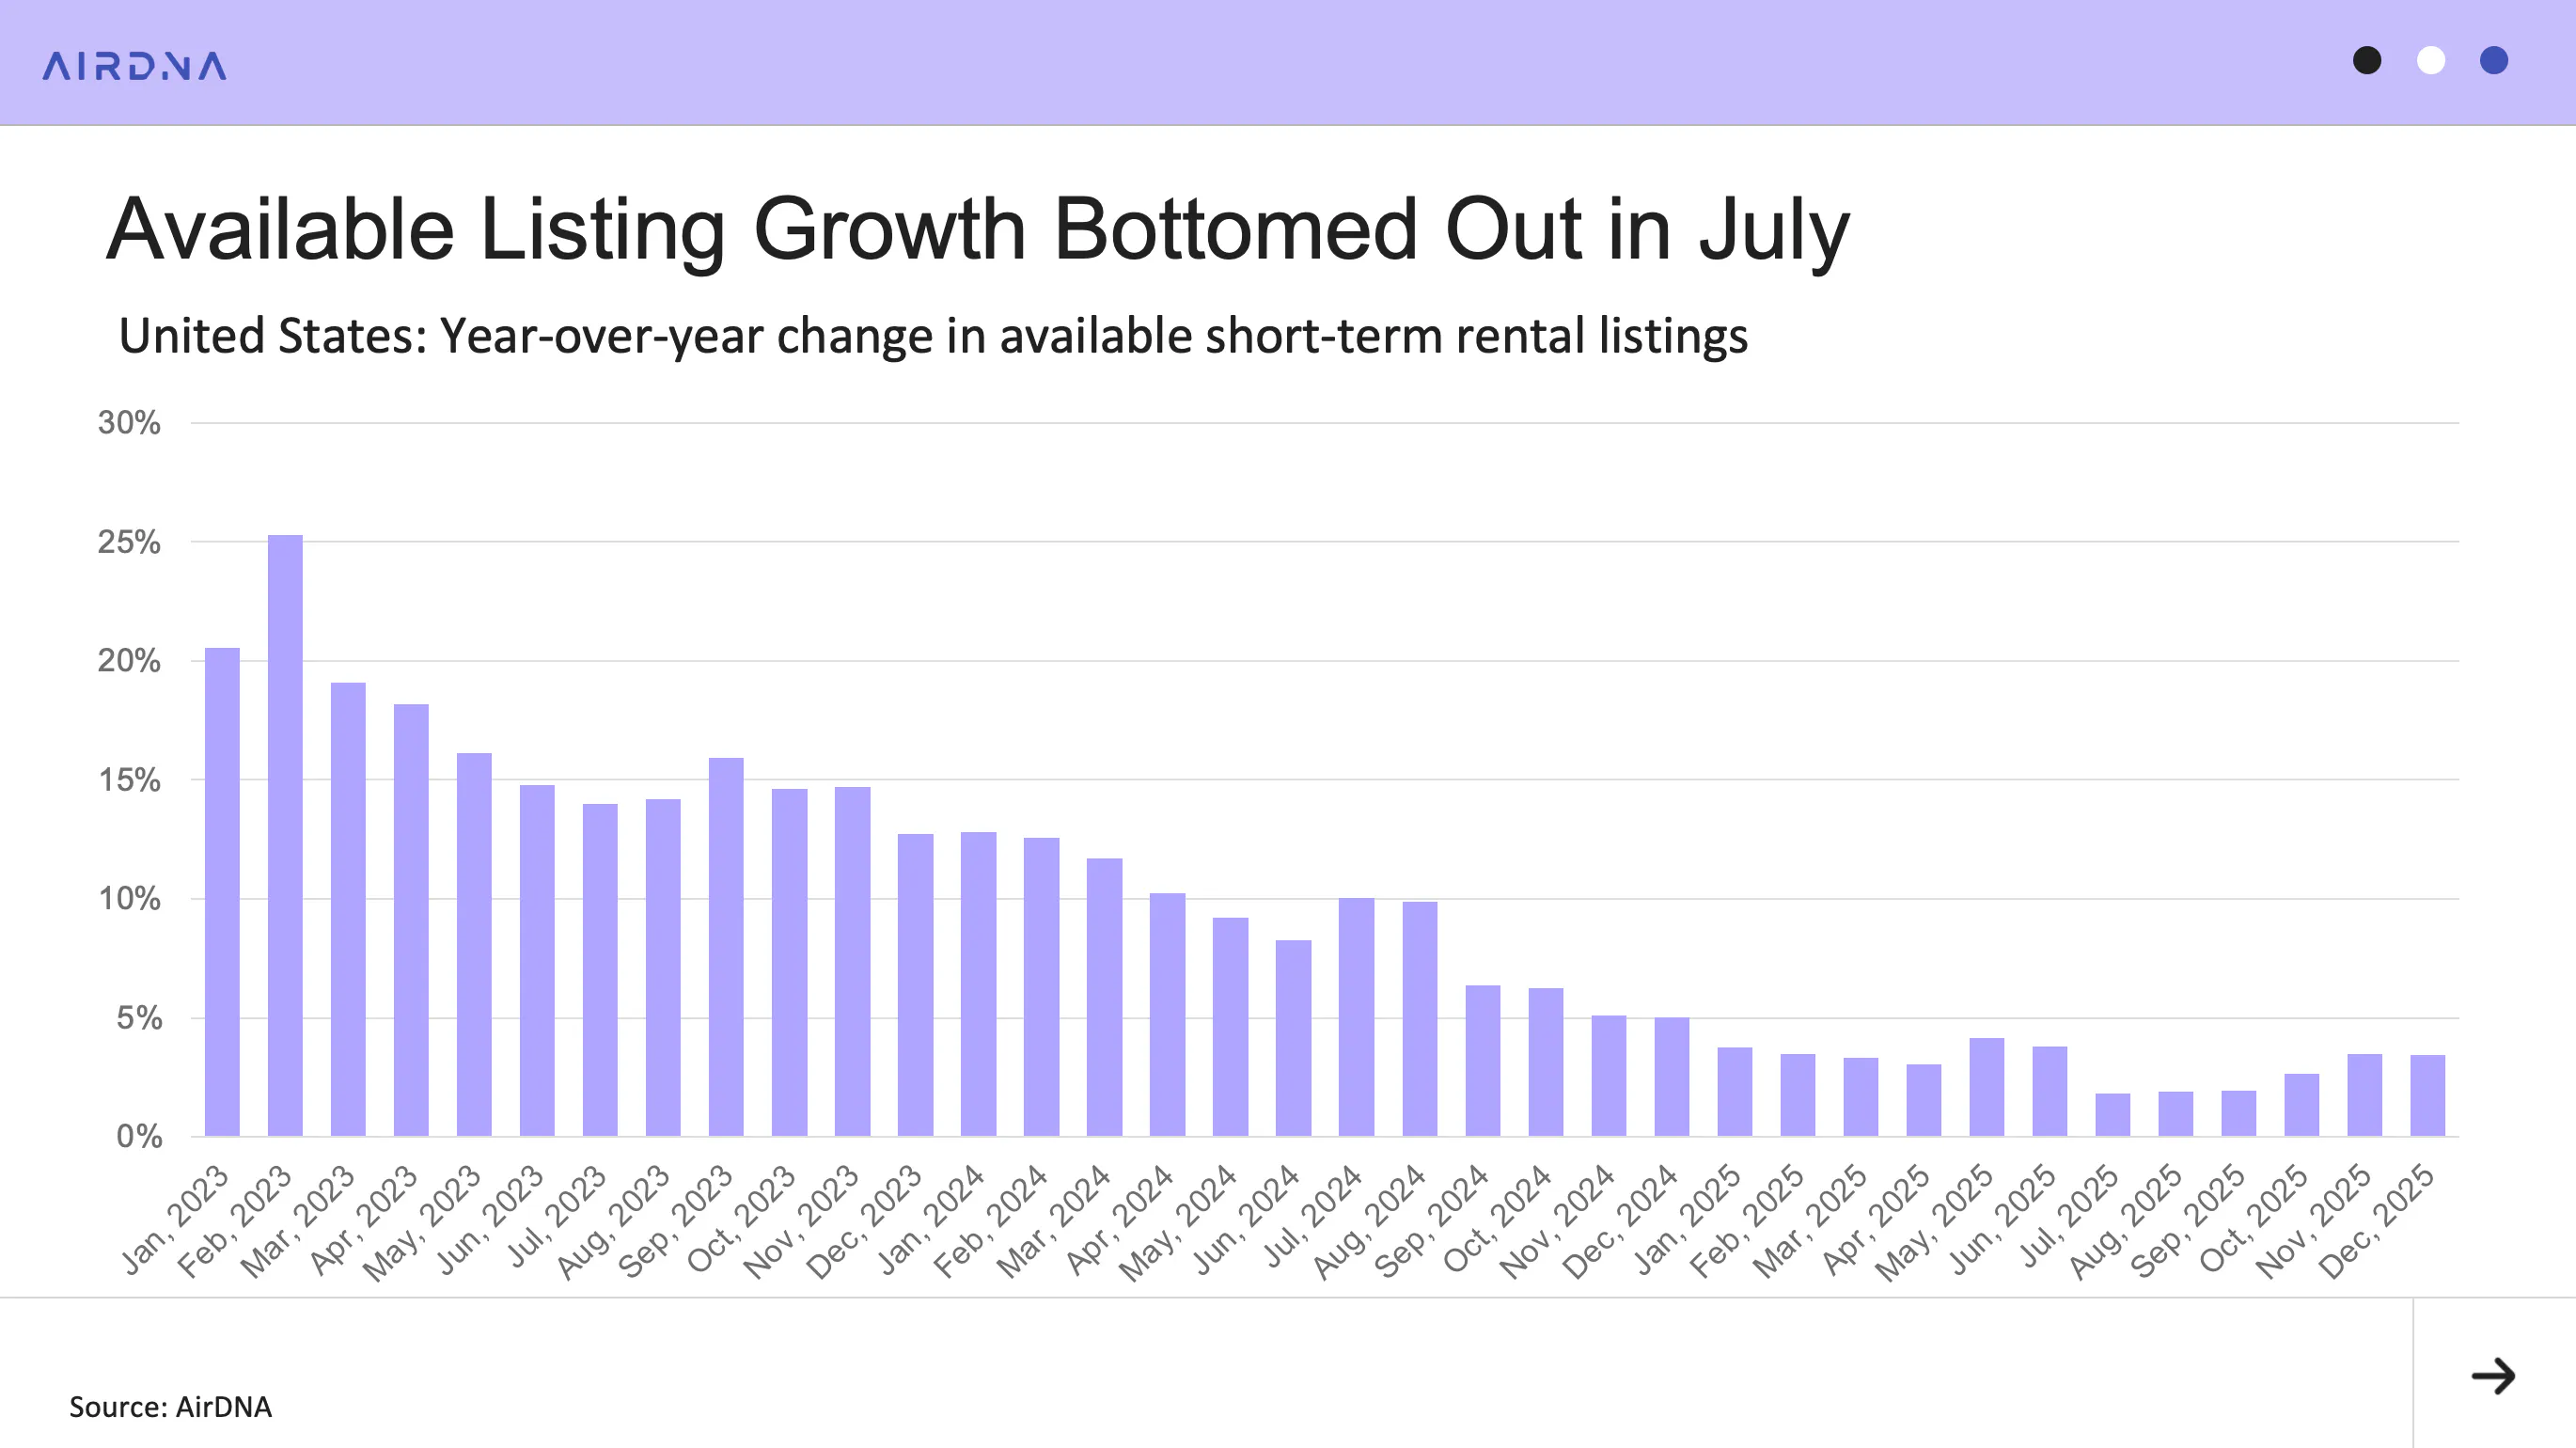
Supply growth slowed sharply in 2025 after several years of deceleration, reaching a low point in July at 1.8%. This marked the weakest rate of supply growth recorded by AirDNA for the U.S. short-term rental market.
Since then, conditions have shifted modestly. The average 30-year mortgage rate reported by Freddie Mac declined from 6.85% in early June to roughly 6.10% by year end. Over the same period, supply growth rebounded to 3.5% in November and eased slightly to 3.4% in December.
While falling mortgage rates may be contributing to this uptick, the long lag between housing market transactions and new short-term rental listings suggests other factors are also at play. Some of the recent growth likely reflects the gradual resolution of trade policy uncertainty earlier in the year, along with longer-term market dynamics rather than immediate STR financing conditions alone.
Looking ahead, further supply acceleration is expected in 2026 as the effects of lower mortgage rates continue to filter through the housing and short-term rental markets.
Demand Growth Picked Up by Year End
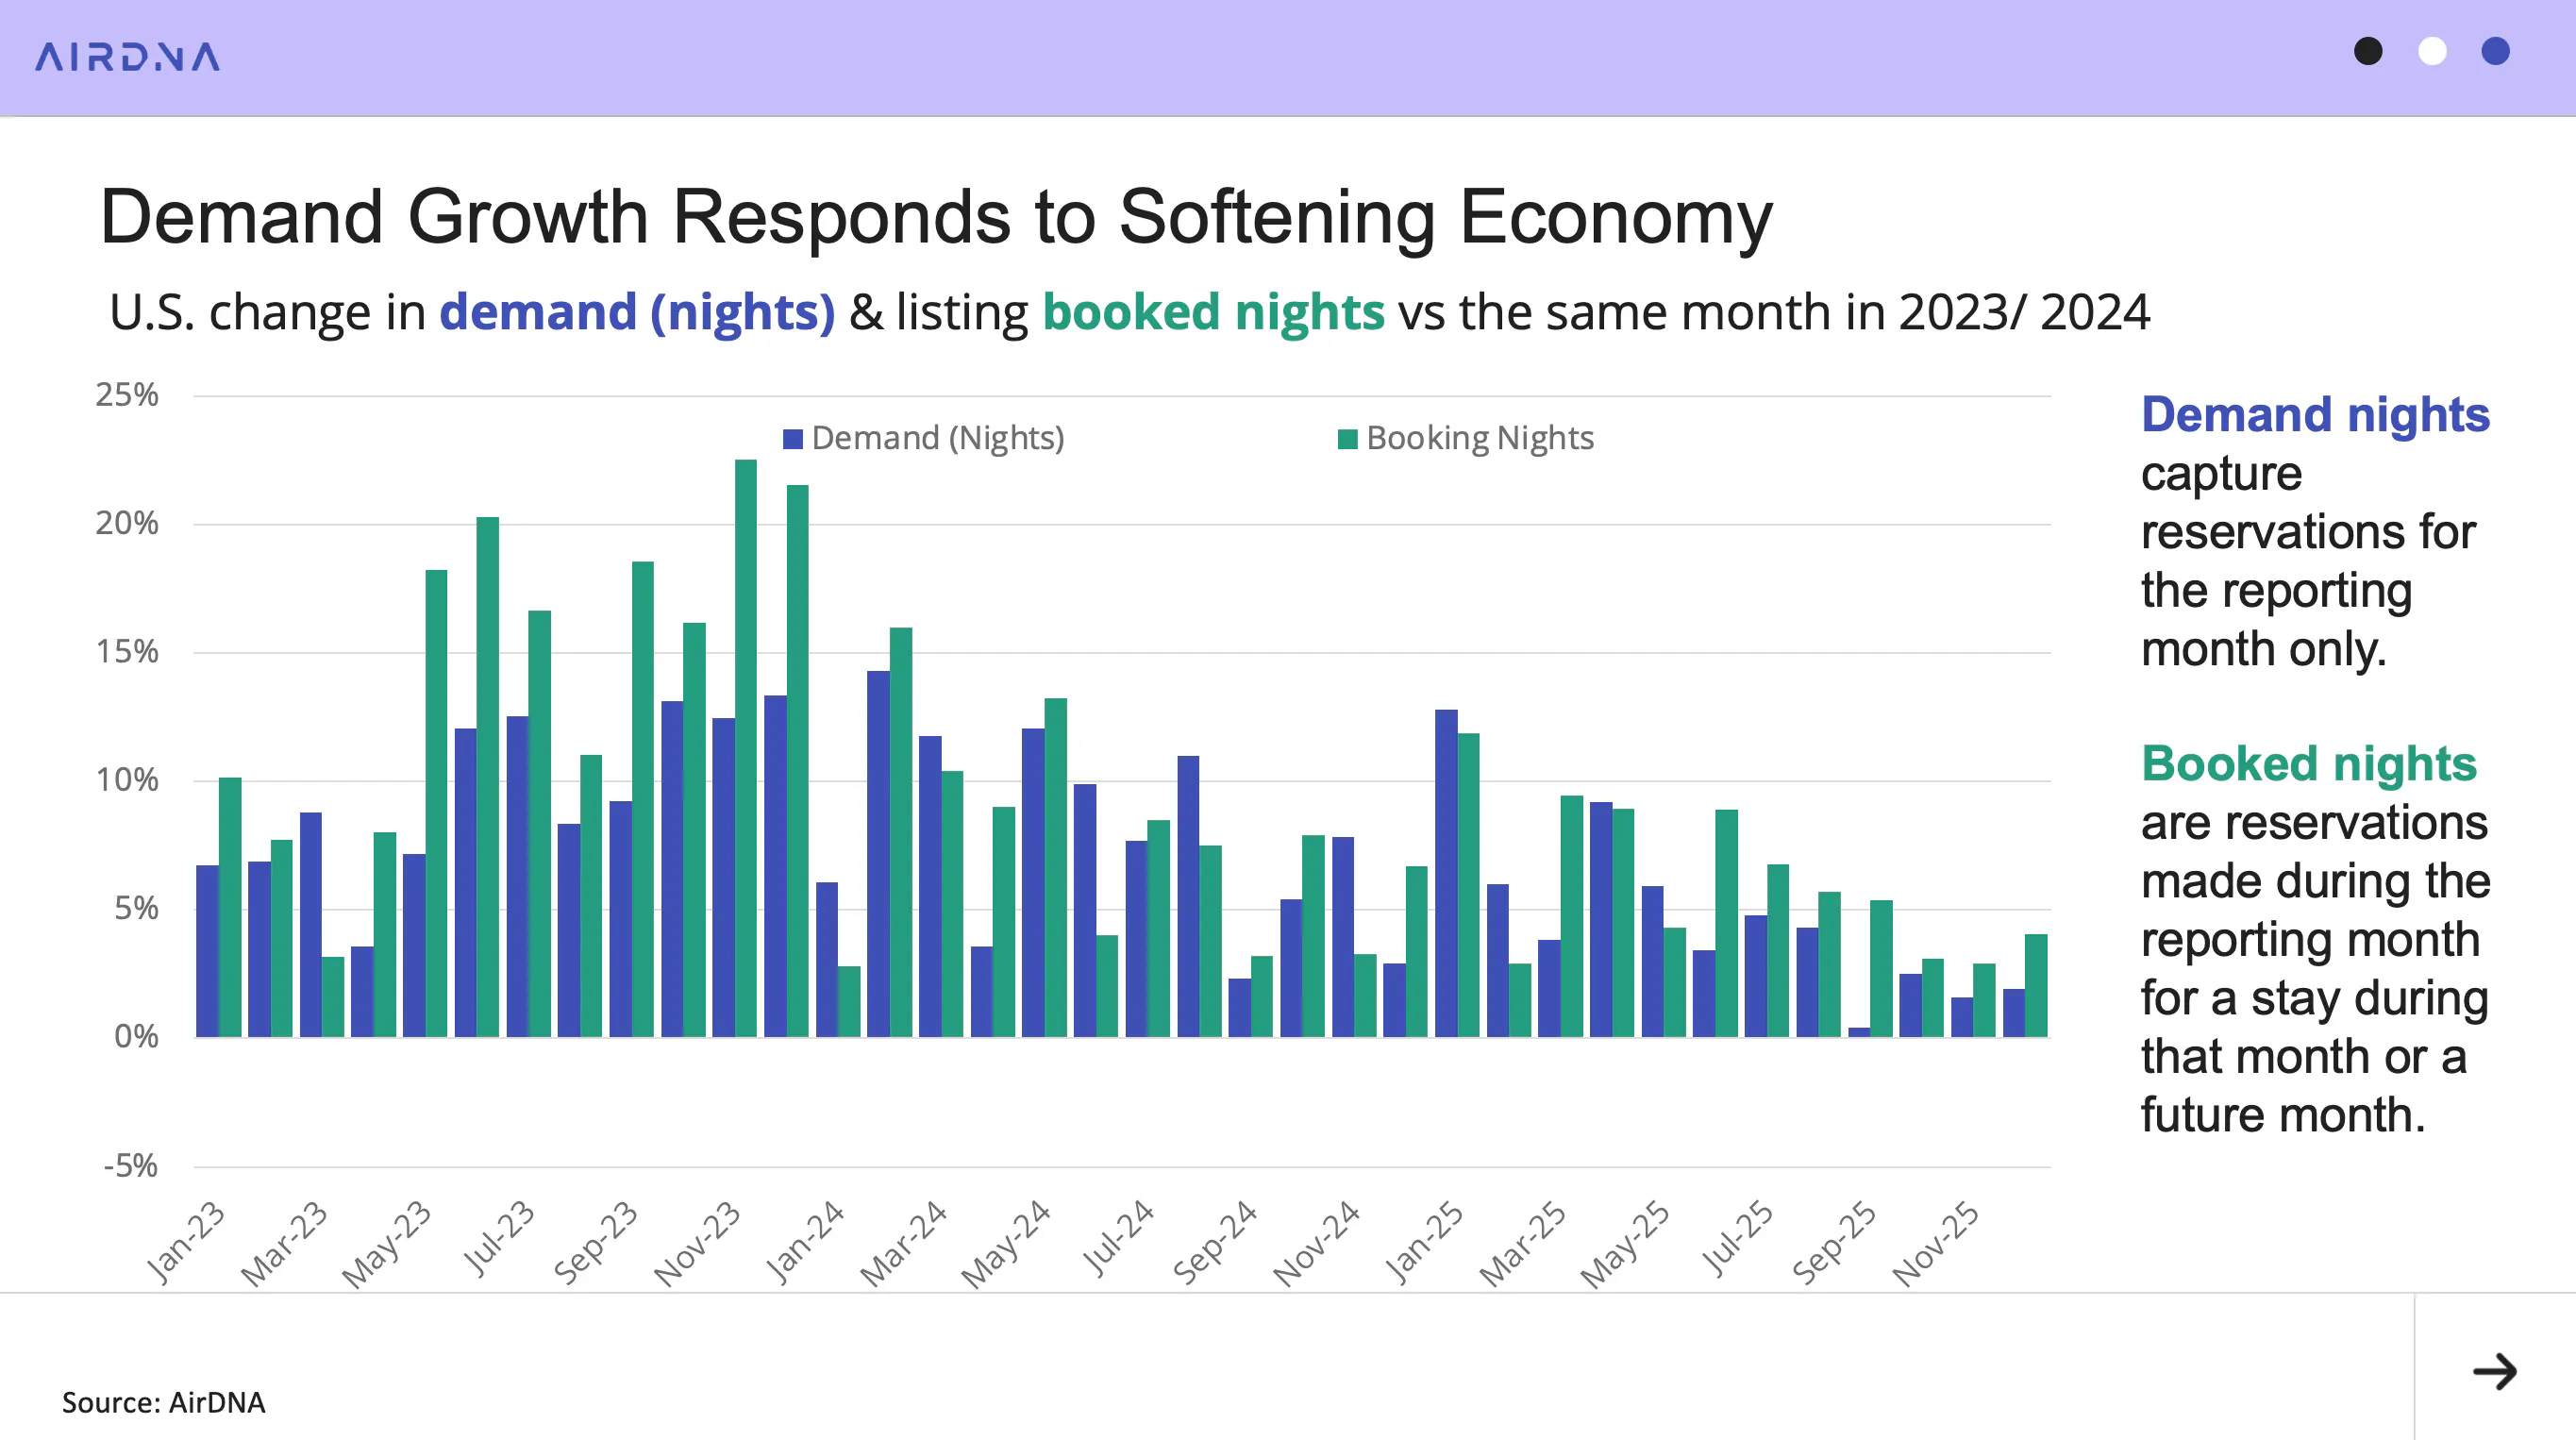
Demand followed a slightly different trajectory from supply in late 2025. Excluding September, which was affected by the Labor Day calendar shift, the low point in demand growth occurred in November. Growth then strengthened modestly in December, rising from 1.6% year-over-year (YoY) in November to 1.9% in December.
More encouraging than the increase in demand nights was the acceleration in booking growth. Because bookings made within a given month can apply to stays later in the year, booking activity often serves as an early indicator of future demand.
Booking growth increased from 2.9% YoY in November to a healthier 4.1% in December, suggesting improved forward-looking demand heading into early 2026.
Year in Review: 2025 Occupancy Level with 2024, But Trend Still Down
U.S. short-term rental occupancy in 2025 landed at 56.9%, a roughly quarter-percentage-point increase from 2024’s 56.7%. While the annual figure suggests stability, performance varied significantly over the course of the year.
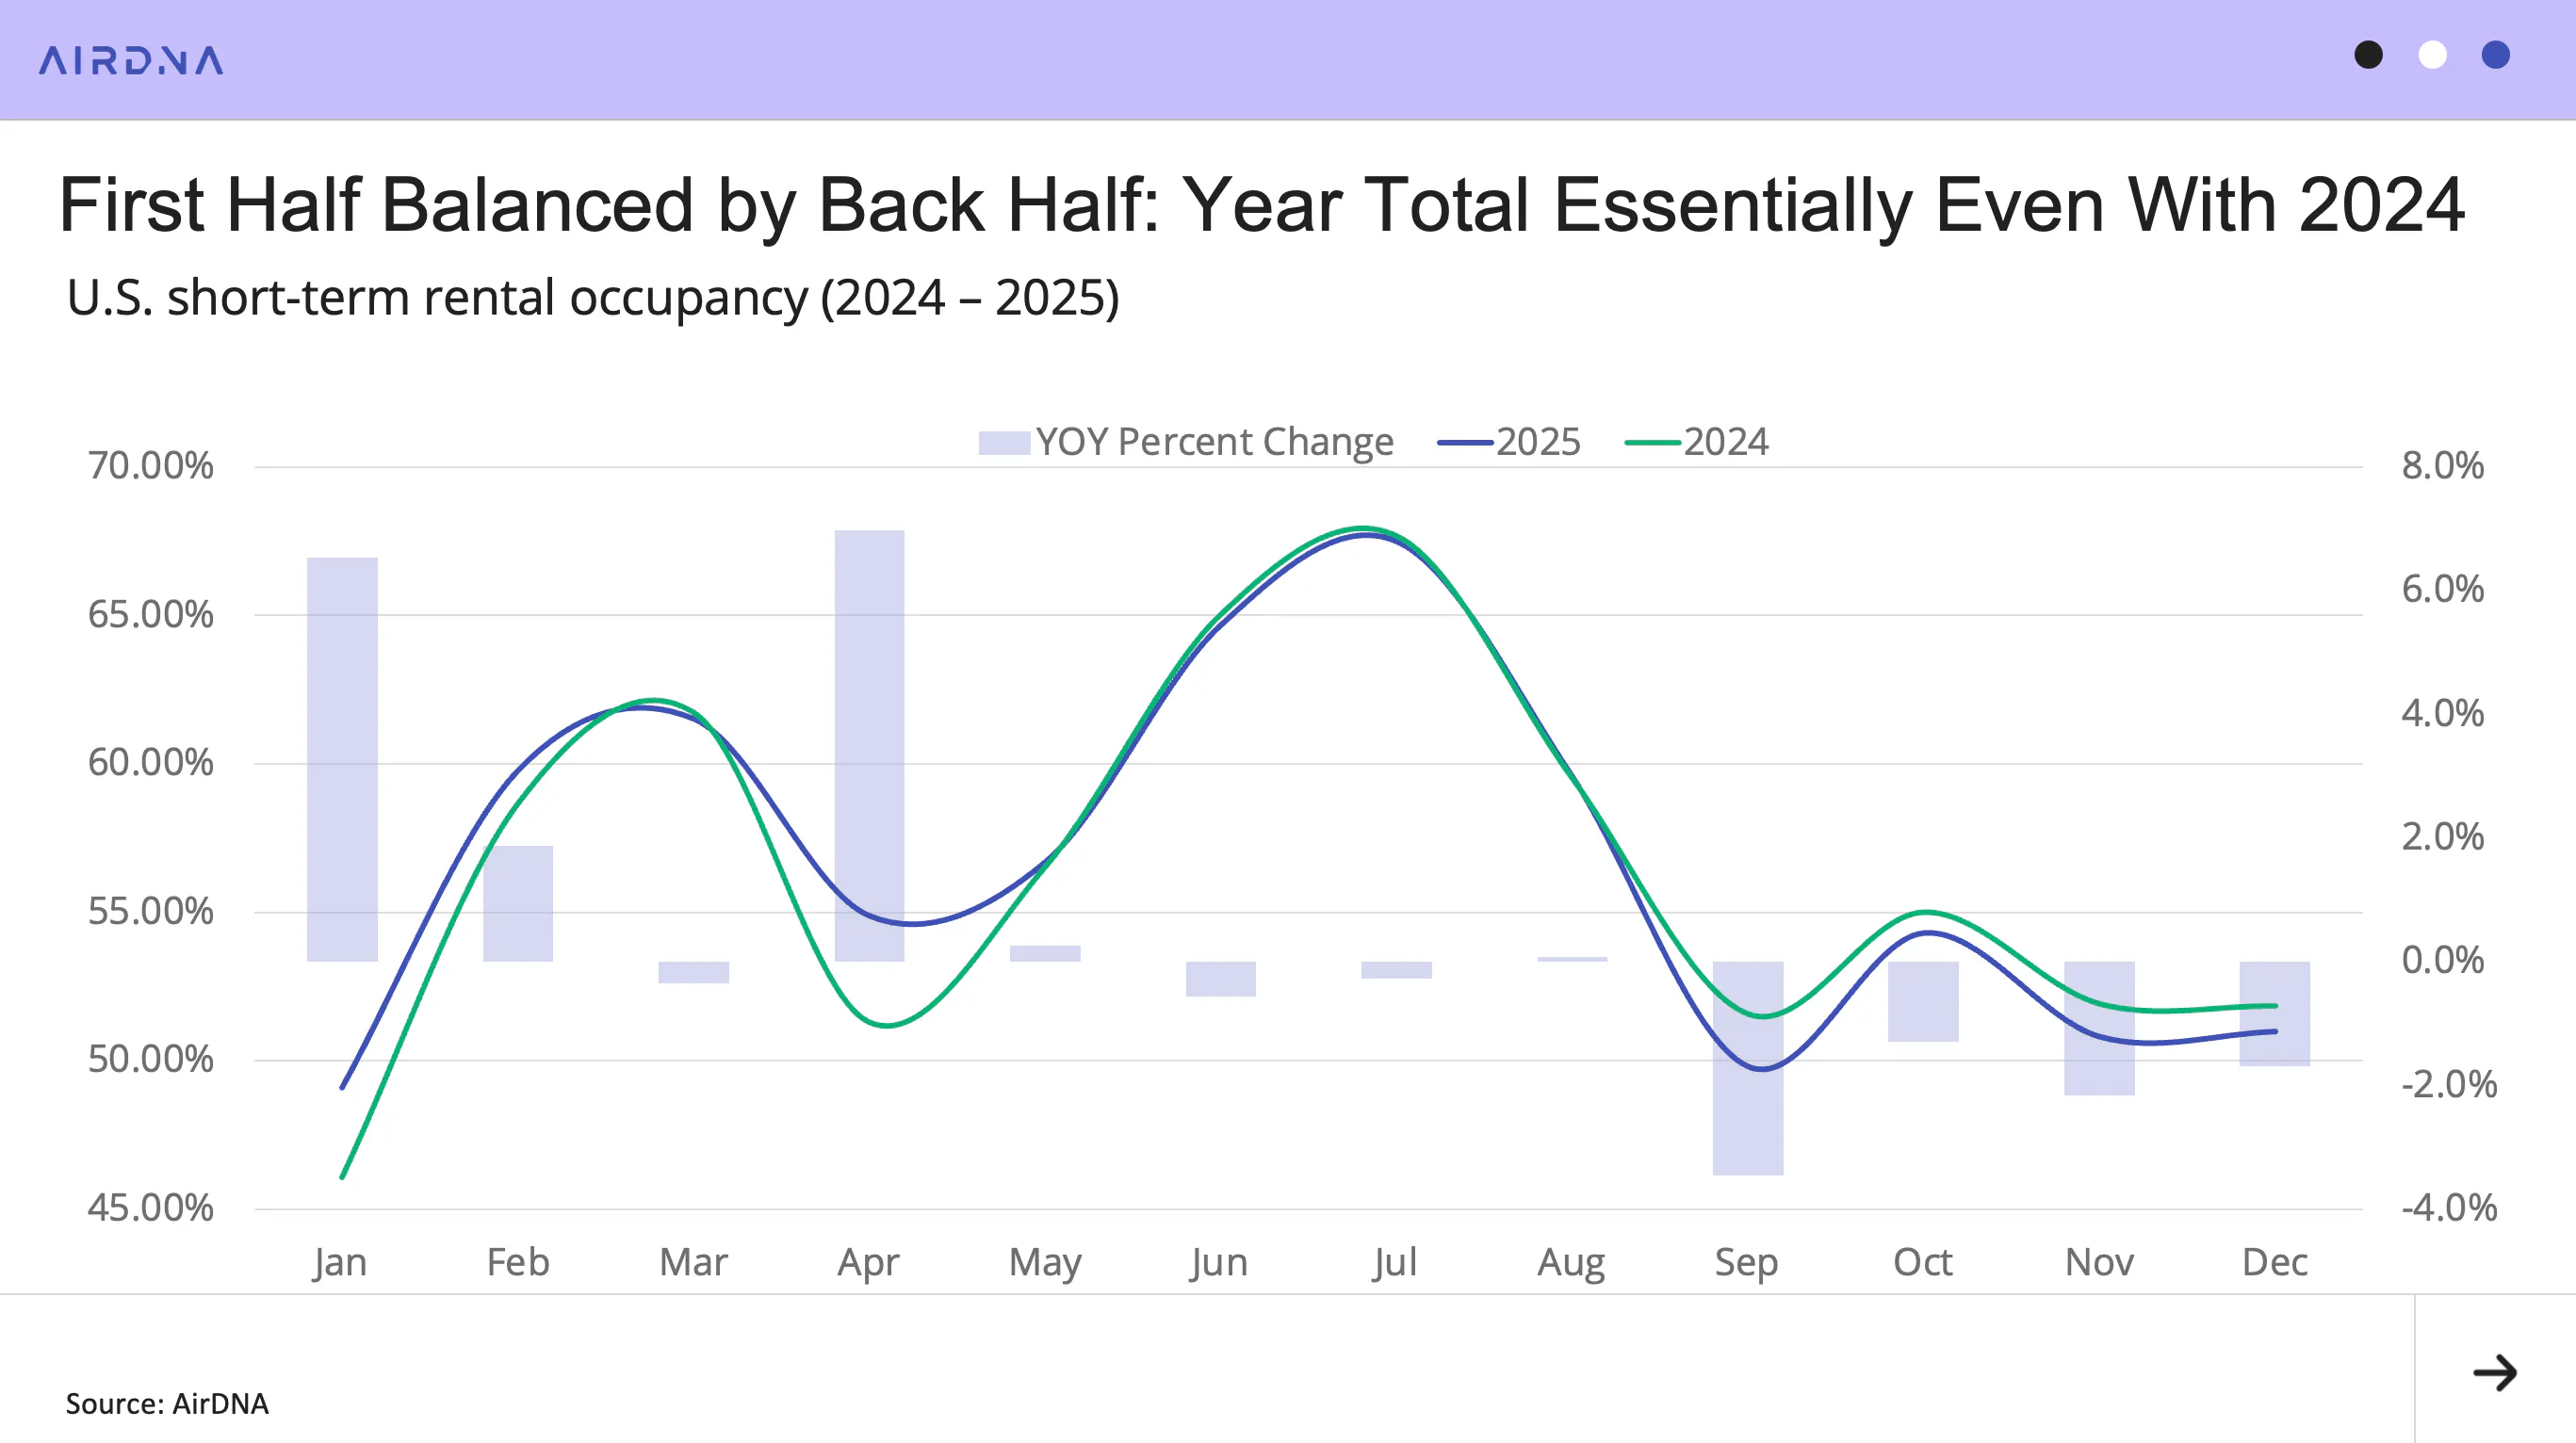
Examining occupancy across the two years shows that 2025 began strong, posting sizable gains in January, February, and April. As the year progressed, trade policy uncertainty, lingering inflation, a softening labor market, and declining consumer confidence appeared to weigh on demand. As a result, occupancy declined year-over-year in every month after May.
The most pronounced decline occurred in September. These declines in occupancy also appear to have translated into weaker pricing power for hosts, with September posting the largest YoY decline in ADR since 2023.
Pricing and the Role of Inflation
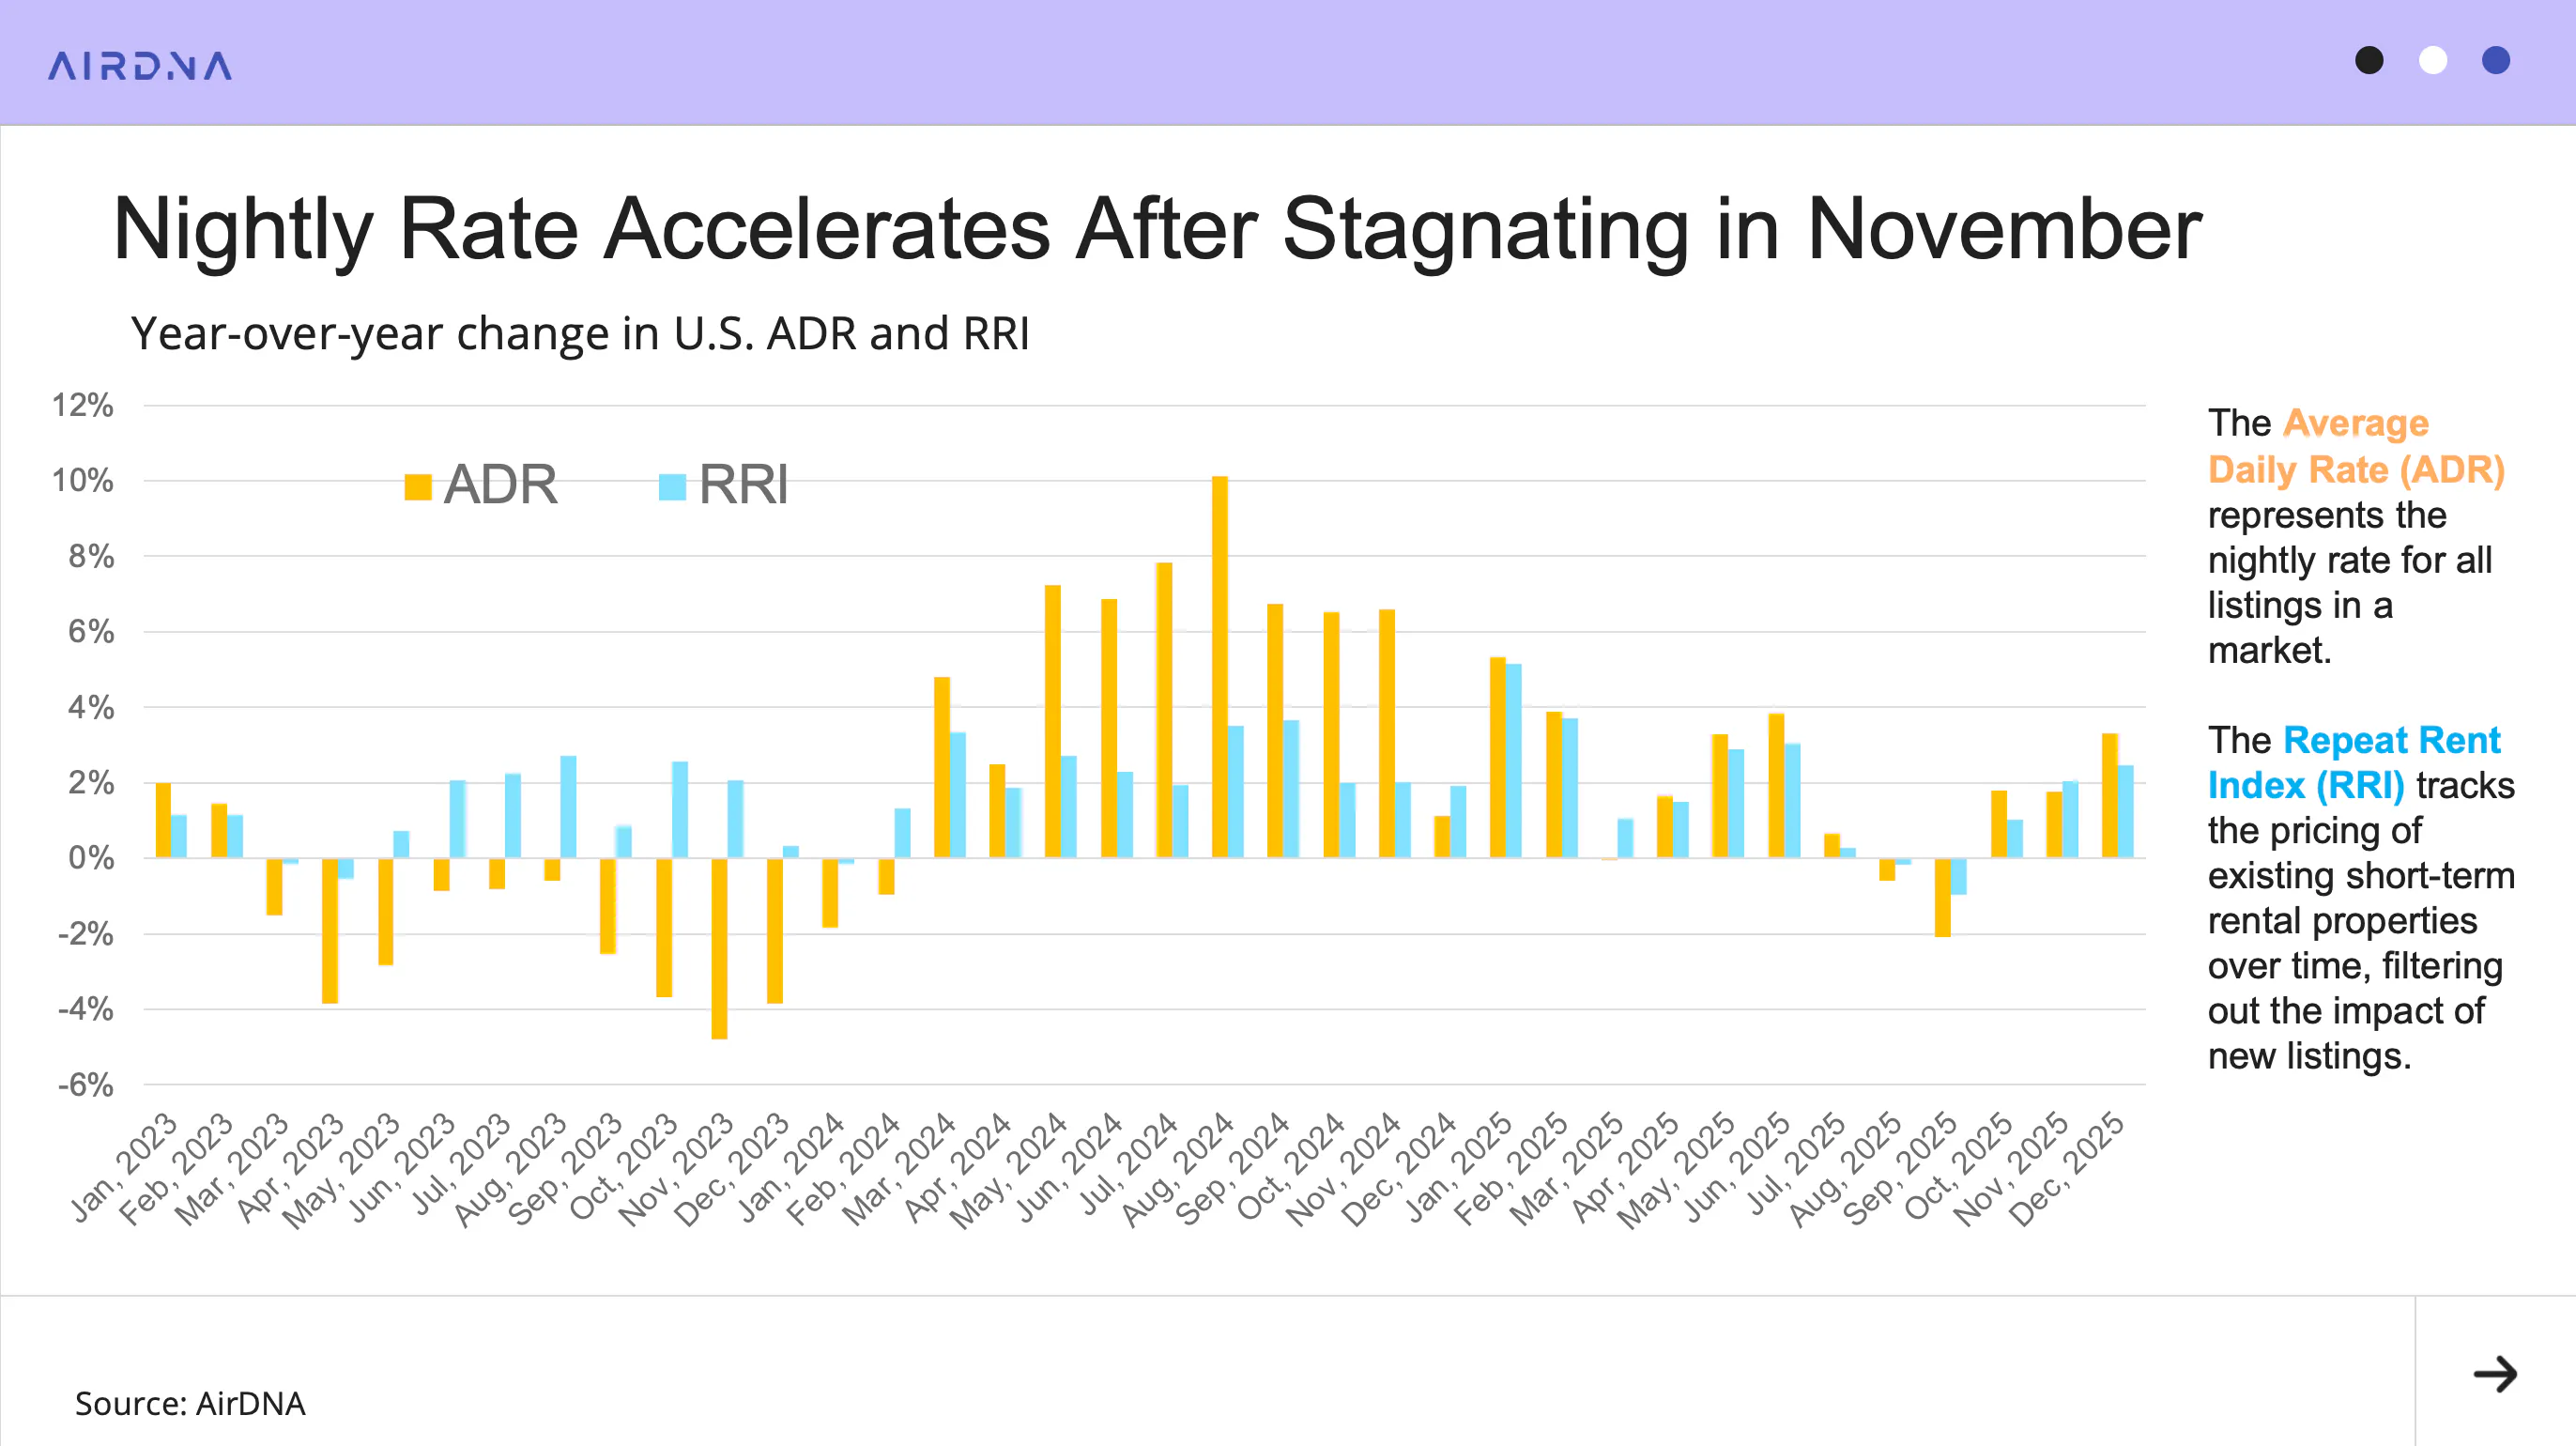
While pricing posted several strong months in 2025, resurgent inflation following April’s “Liberation Day” tariff announcement appears to have once again constrained consumer budgets. This led to disappointing summer rates and full-year ADR growth of 1.8%, well below the 2.7% average inflation rate.
Rate growth strengthened toward the end of the year, however, accelerating to 3.3% year-over-year in December after two months of 1.8% growth. The Repeat Rent Index (RRI), which excludes the effect of new entrants to the market (mix shift), and reflects ADR changes made by existing operators, has also accelerated for three consecutive months. RRI reached 2.5% year-over-year growth in December.
ADR growth outpacing RRI implies that new entrants to the market are positioning themselves as more upscale than the existing market average. While this pattern has appeared during periods of market growth in the past, high-income consumers were especially prominent in 2025.
Performance Varies Widely by Location Type
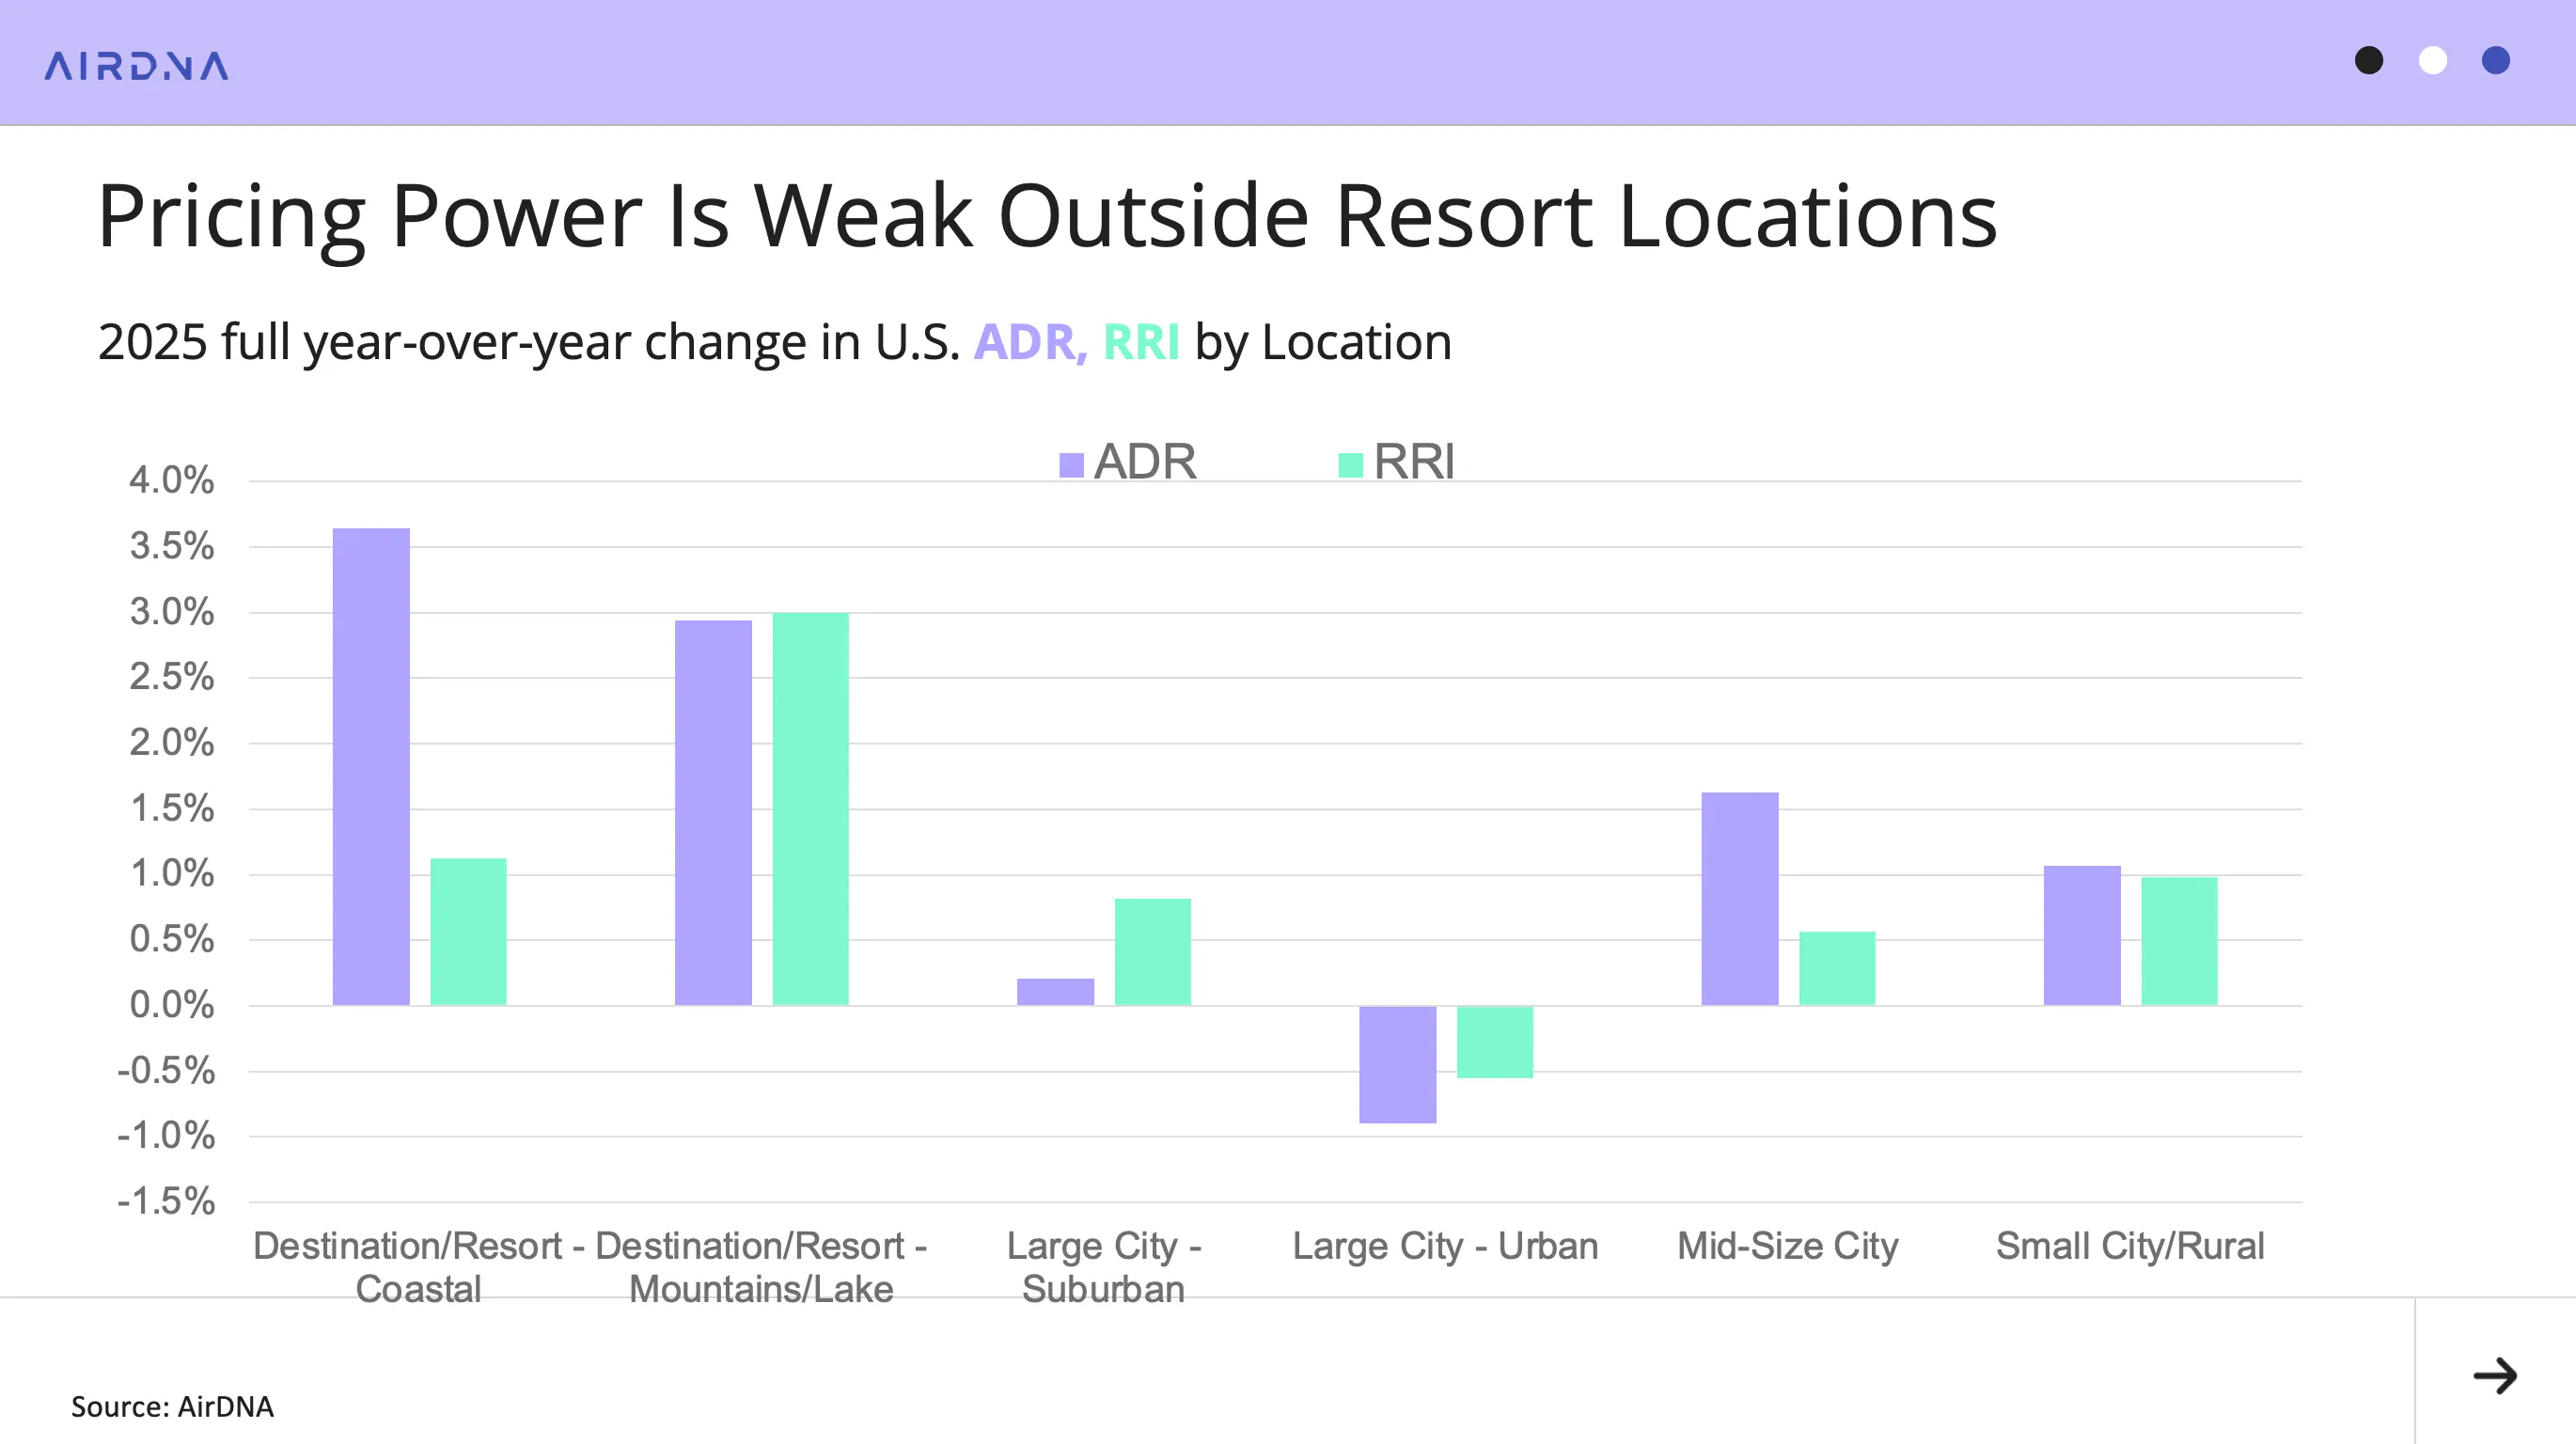
Examining rate growth by location type reveals that only resort markets were able to grow rates ahead of inflation in 2025. Coastal resort locations, in particular, saw RRI grow more slowly than ADR, indicating a pronounced shift toward upscale positioning. Mid-Sized Cities exhibited a similar division between RRI and ADR growth.
Large cities, both Urban and Suburban, posted the weakest ADR growth. In these markets, the relationship between RRI and ADR growth was reversed, suggesting that new entrants were positioning themselves as more budget-friendly. Among all location types, urban cores alone saw declines in both ADR and RRI.
Price Tier Drives Widening Gaps in Market Performance
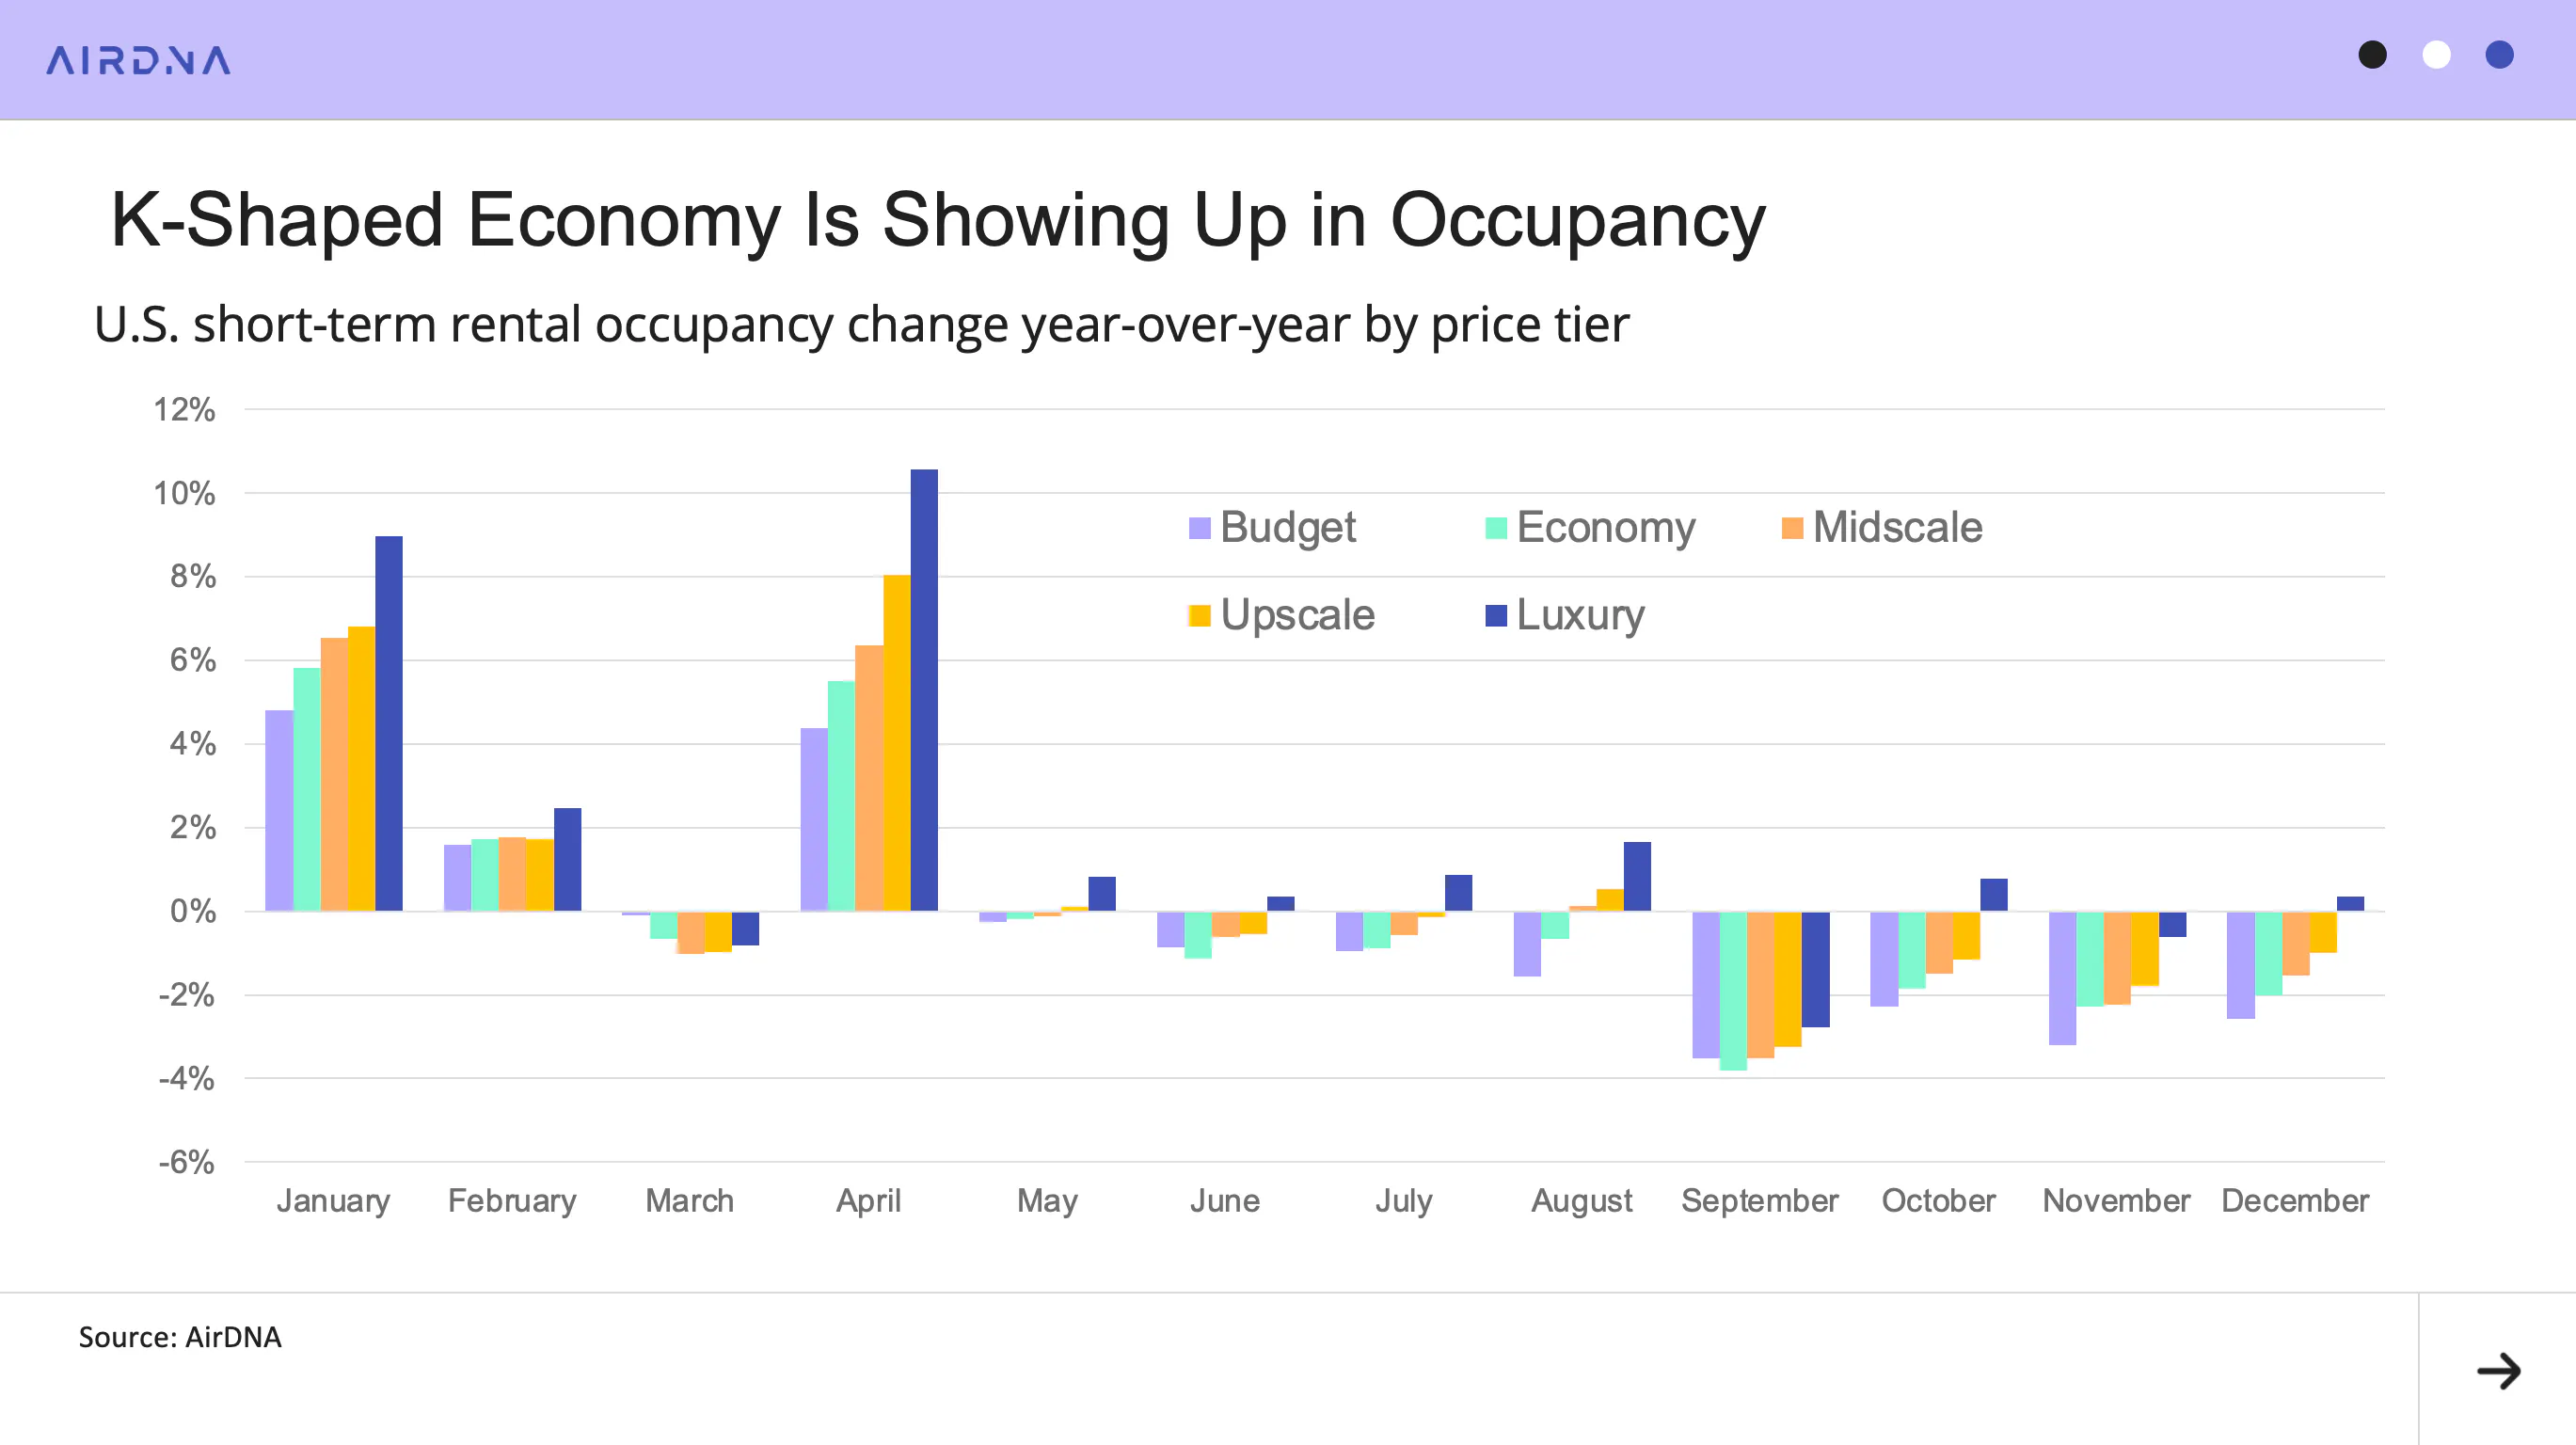
The pattern in rates paints a clear picture of the “K-shaped” economic growth seen throughout 2025. Higher-income travelers continued to support premium leisure destinations such as beach and ski resorts, despite the season, while other locations kept prices lower to maintain occupancy among guests with increasingly stretched budgets.
Price-tier analysis reinforces this trend, with upscale and luxury-tier properties posting stronger occupancy growth than budget and economy listings in nearly every month of 2025. Occupancy growth in the luxury segment was particularly strong in January, when favourable snow conditions boosted ski resort performance, and in April, when the Spring Break calendar shifted from March.
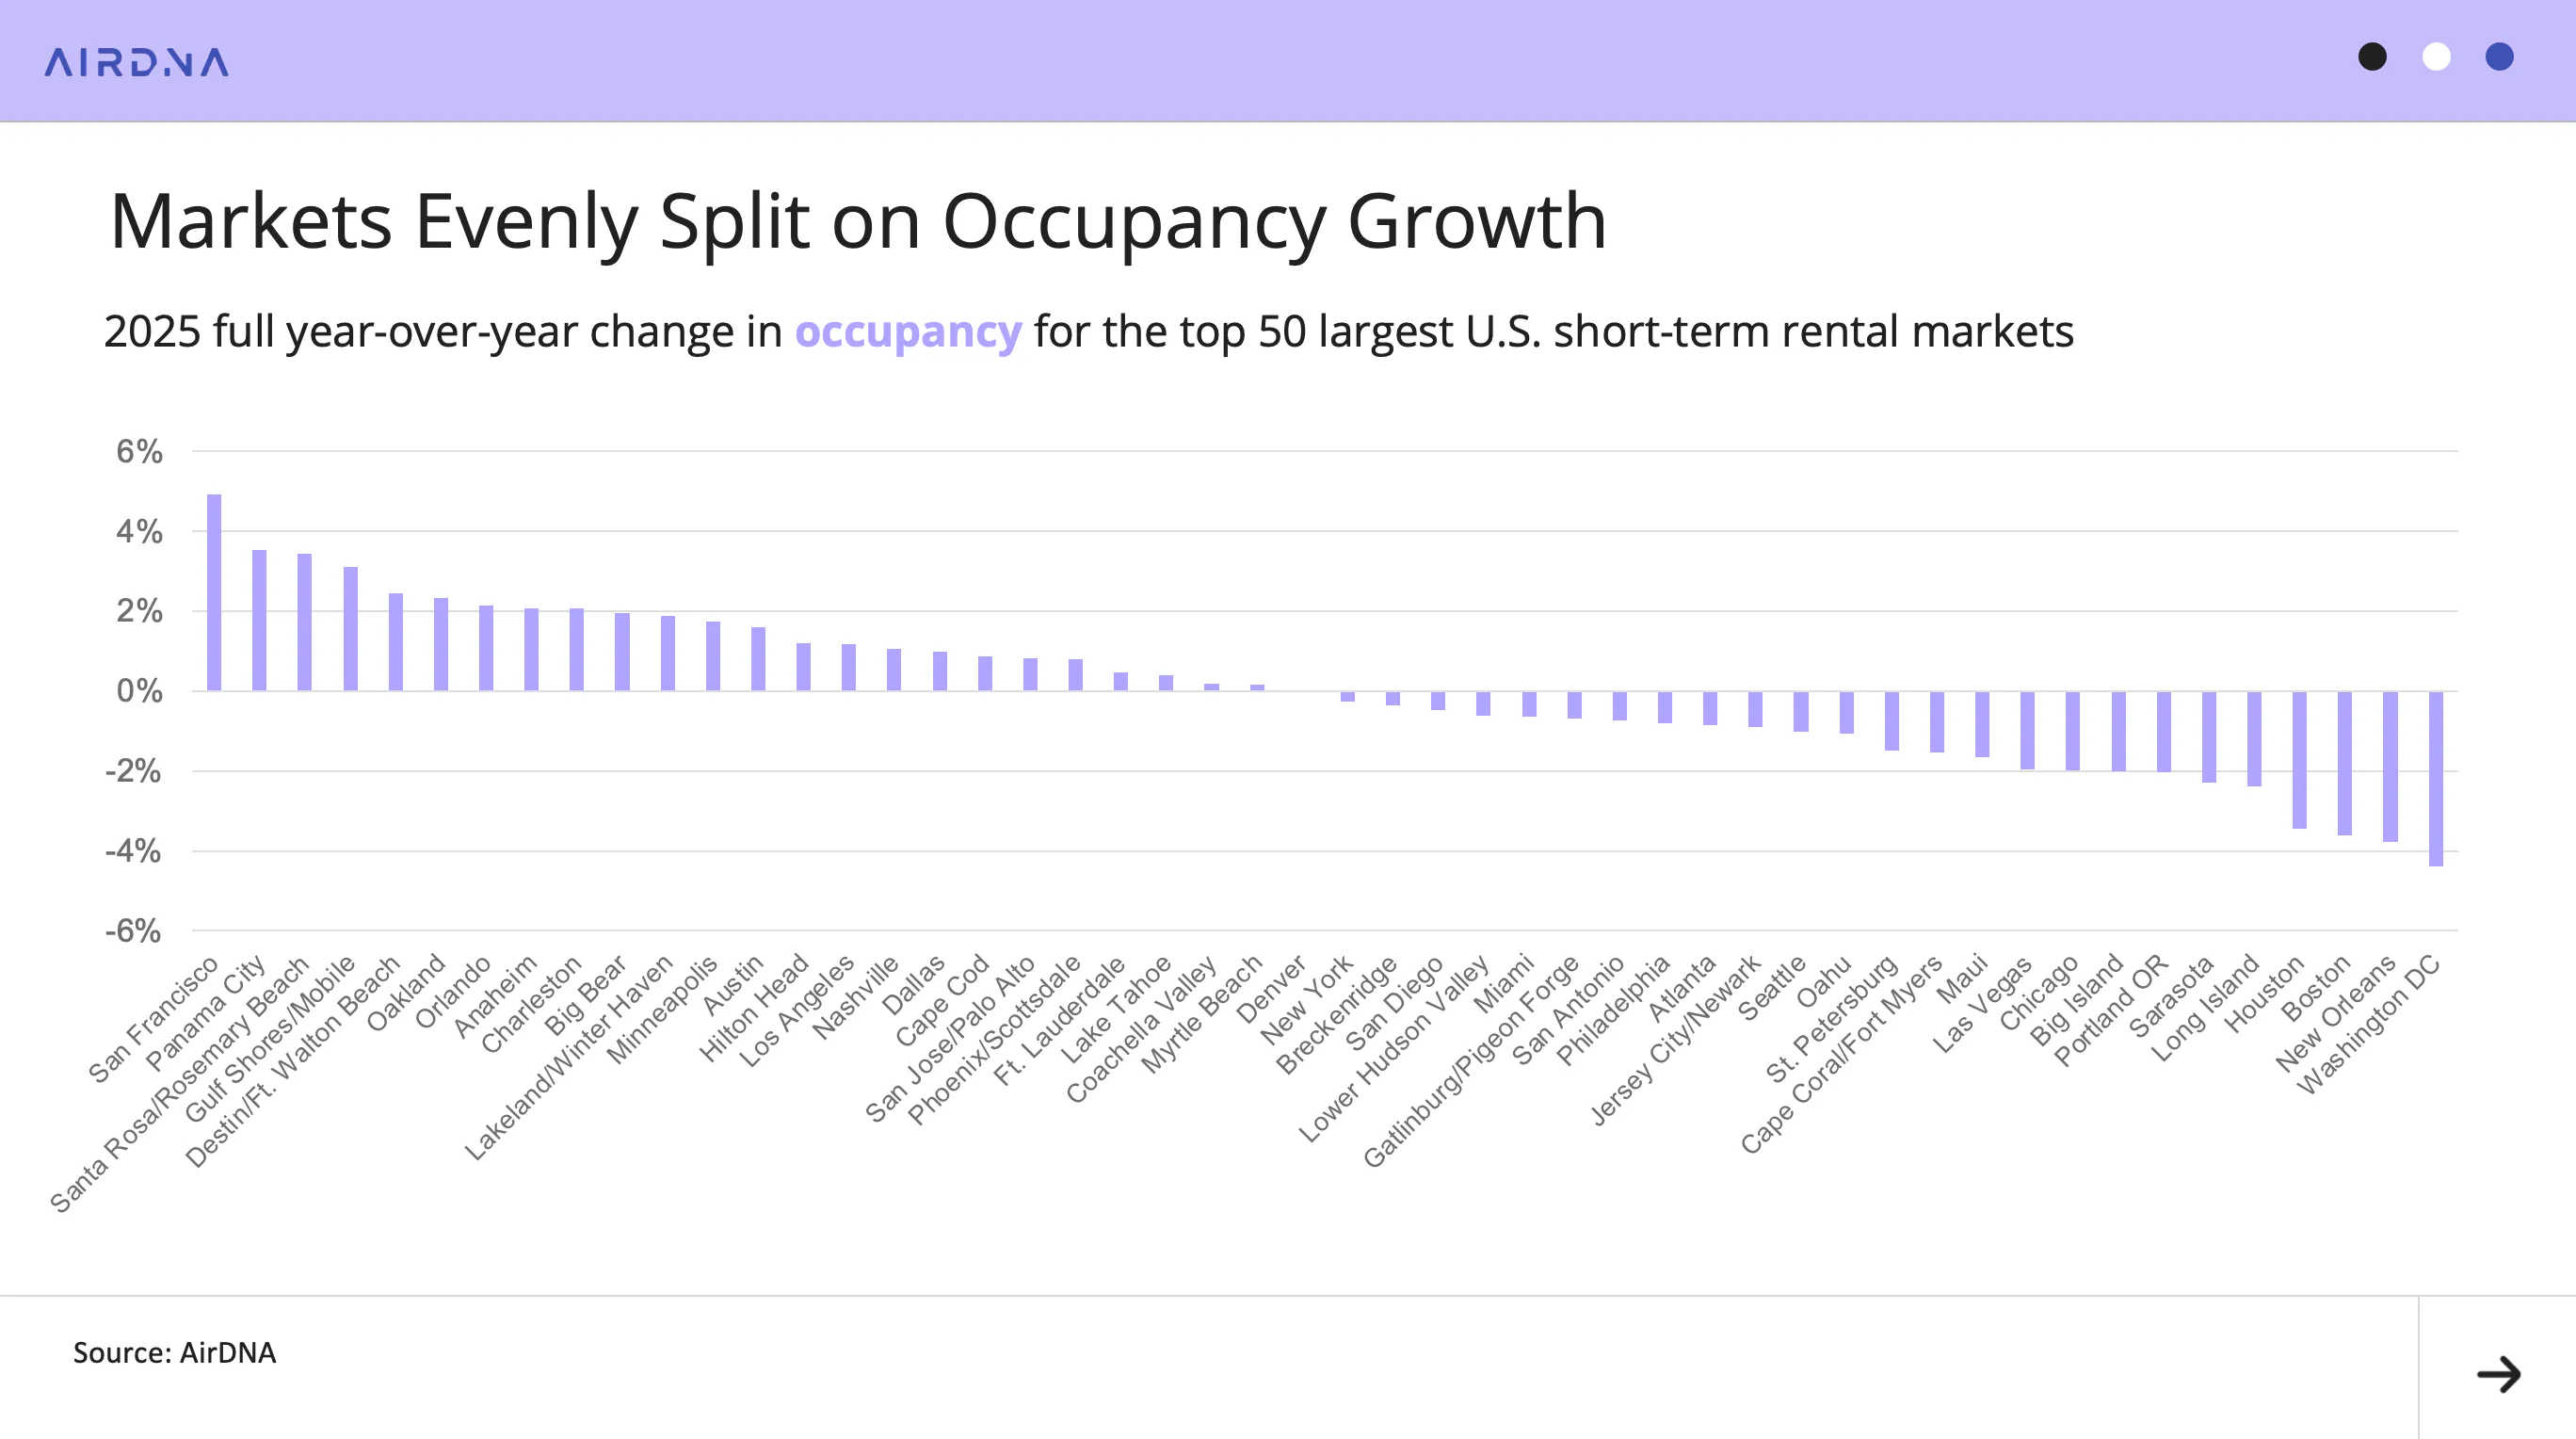
In fact, occupancy remaining essentially unchanged in 2025 from 2024 belies deep divisions within the U.S. aggregate. While the nation as a whole posted the same occupancy, an examination of the top 50 markets reveals an exact split: 25 markets recorded gains and 25 saw declines. Performance ranged from a 4.9% increase in San Francisco to a 4.4% decline in Washington, D.C.
San Francisco, along with other Bay Area markets such as Oakland (+2.3%), experienced unit-level performance gains as regulatory constraints limited competition from new entrants. Several Gulf markets also posted significant occupancy growth, including:
- Panama City, Florida (+3.5%)
- Santa Rosa and Rosemary Beach, Florida (+3.4%)
- Gulf Shores, Alabama and Mobile, Alabama (+3.1%)
- Destin and Fort Walton Beach, Florida (+2.5%)
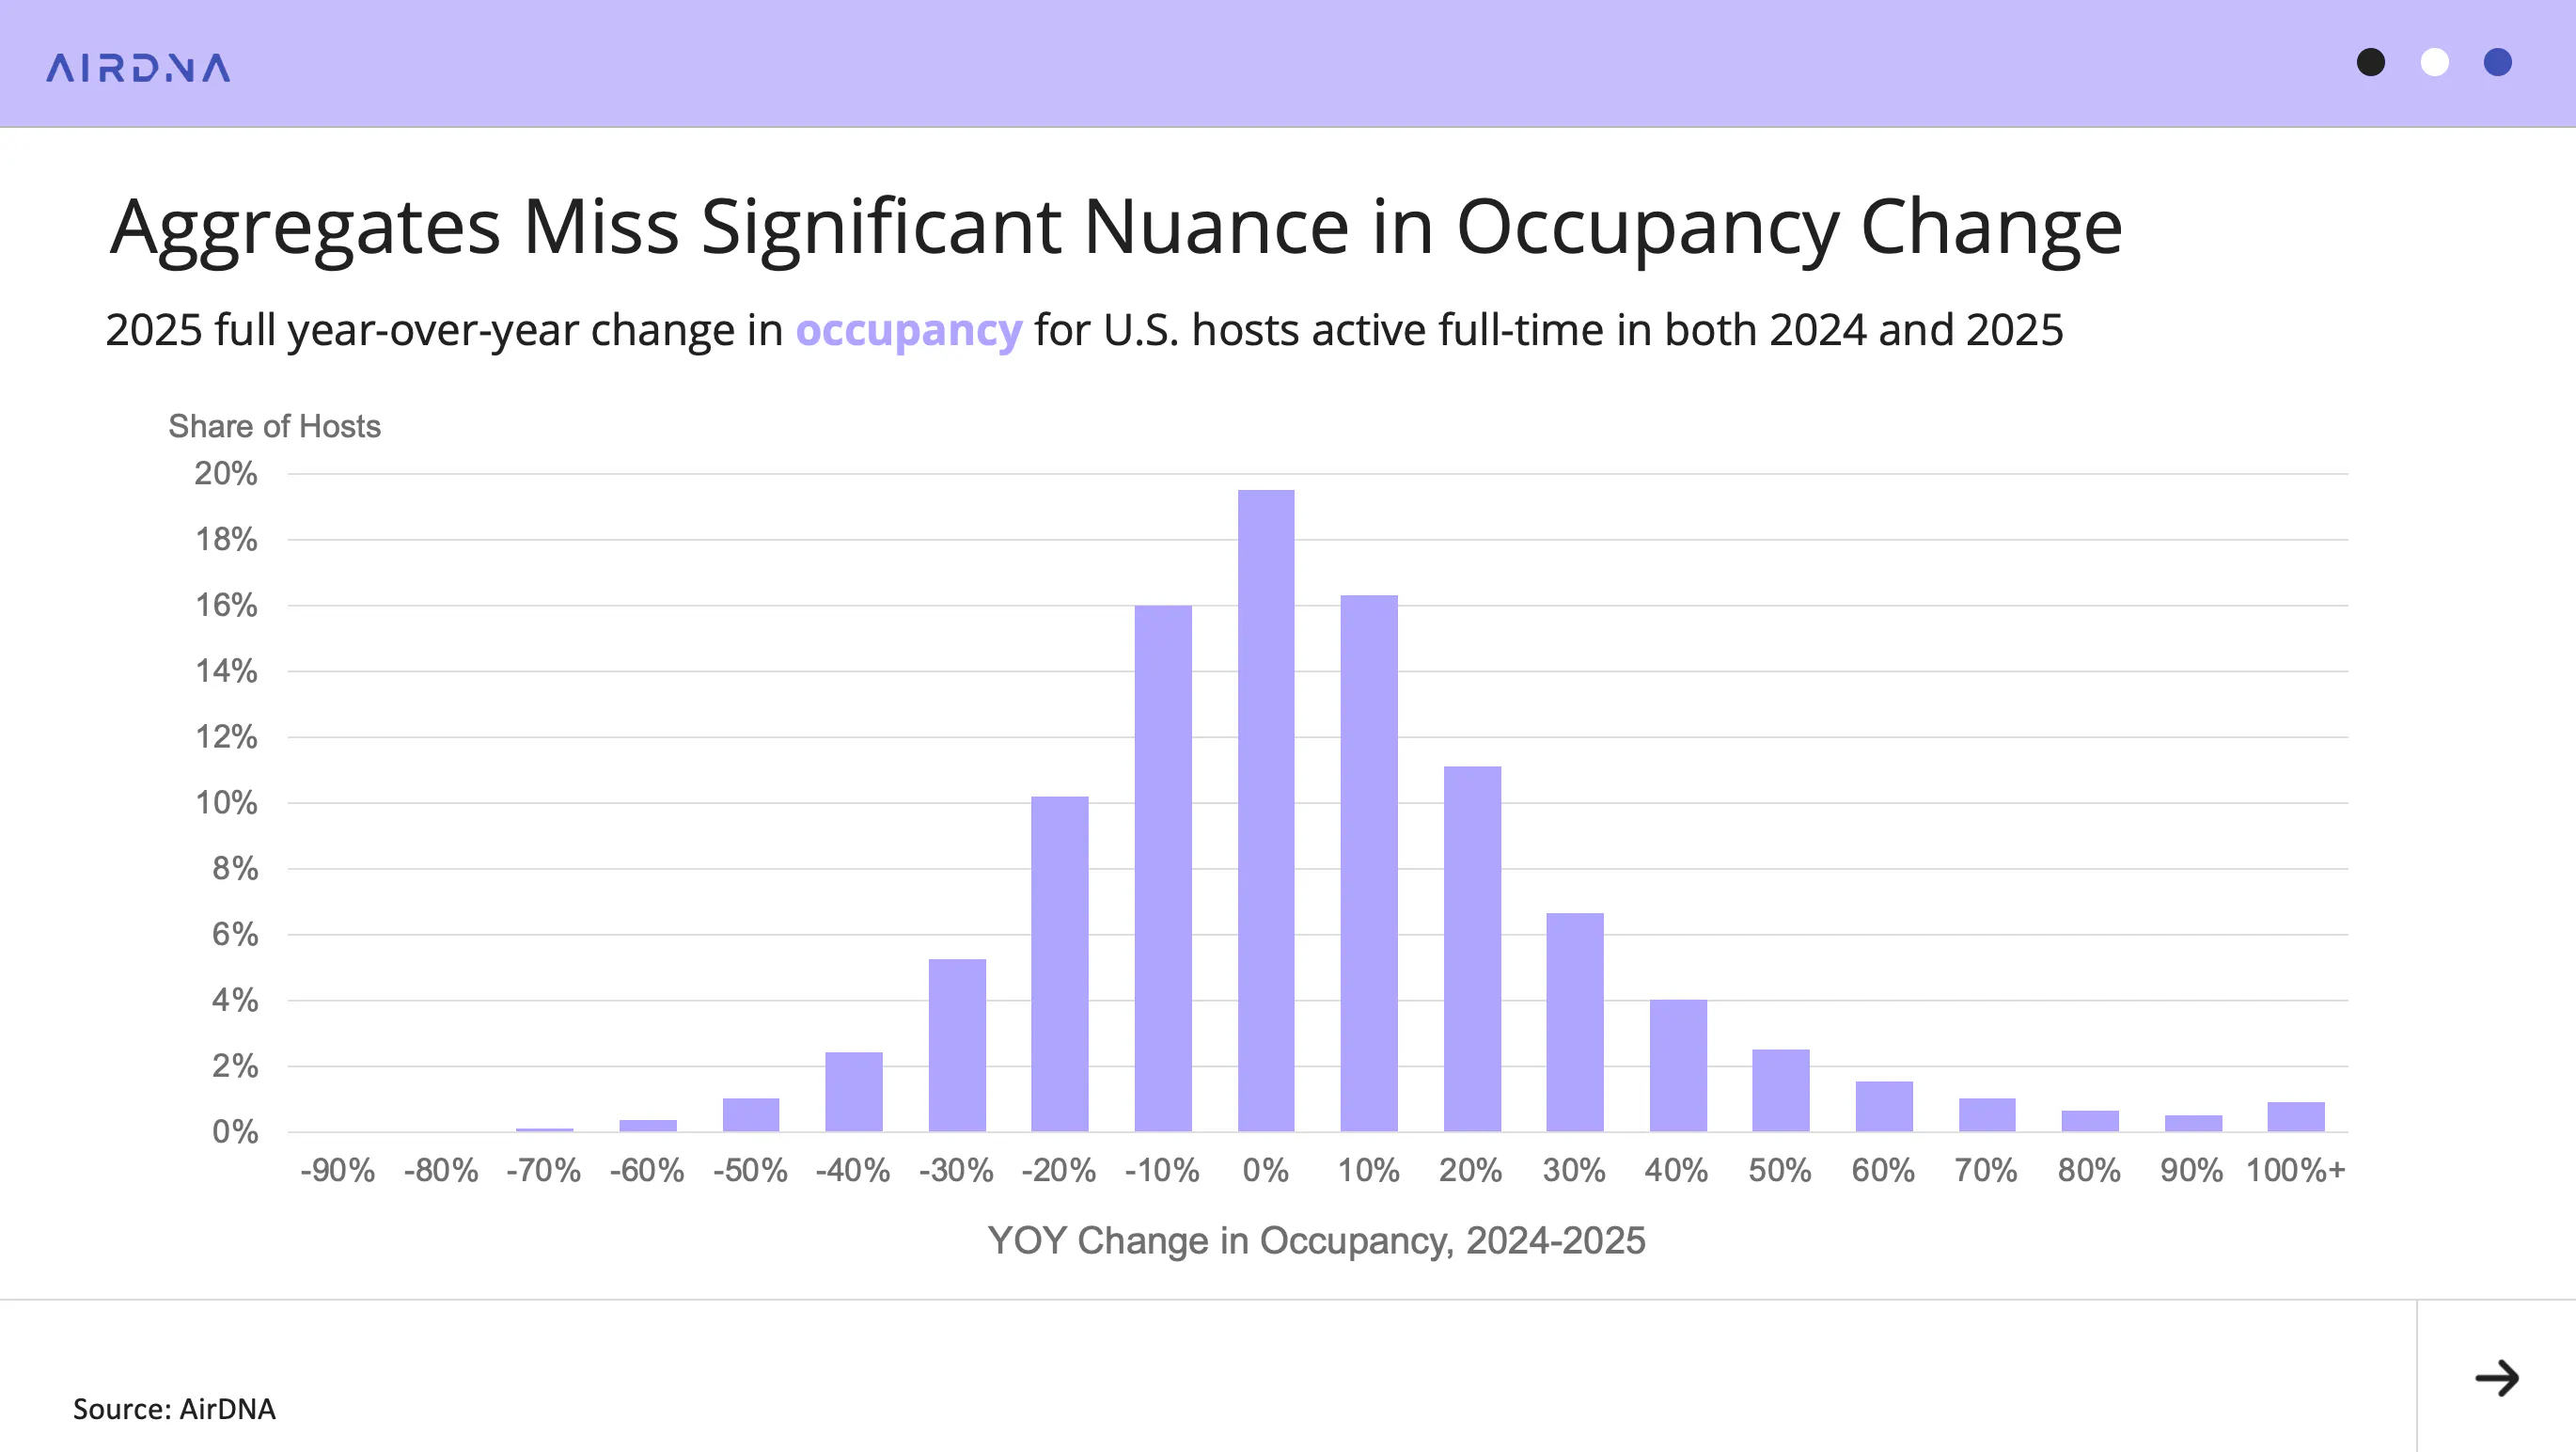
The split in occupancy performance was not limited to markets. Among full-time hosts active in both 2024 and 2025, the average change in occupancy was centred near zero. However, the distribution of outcomes was wide, with nearly one in five hosts experiencing occupancy declines of 20% or more.
Pacing and 2026 Performance Insights
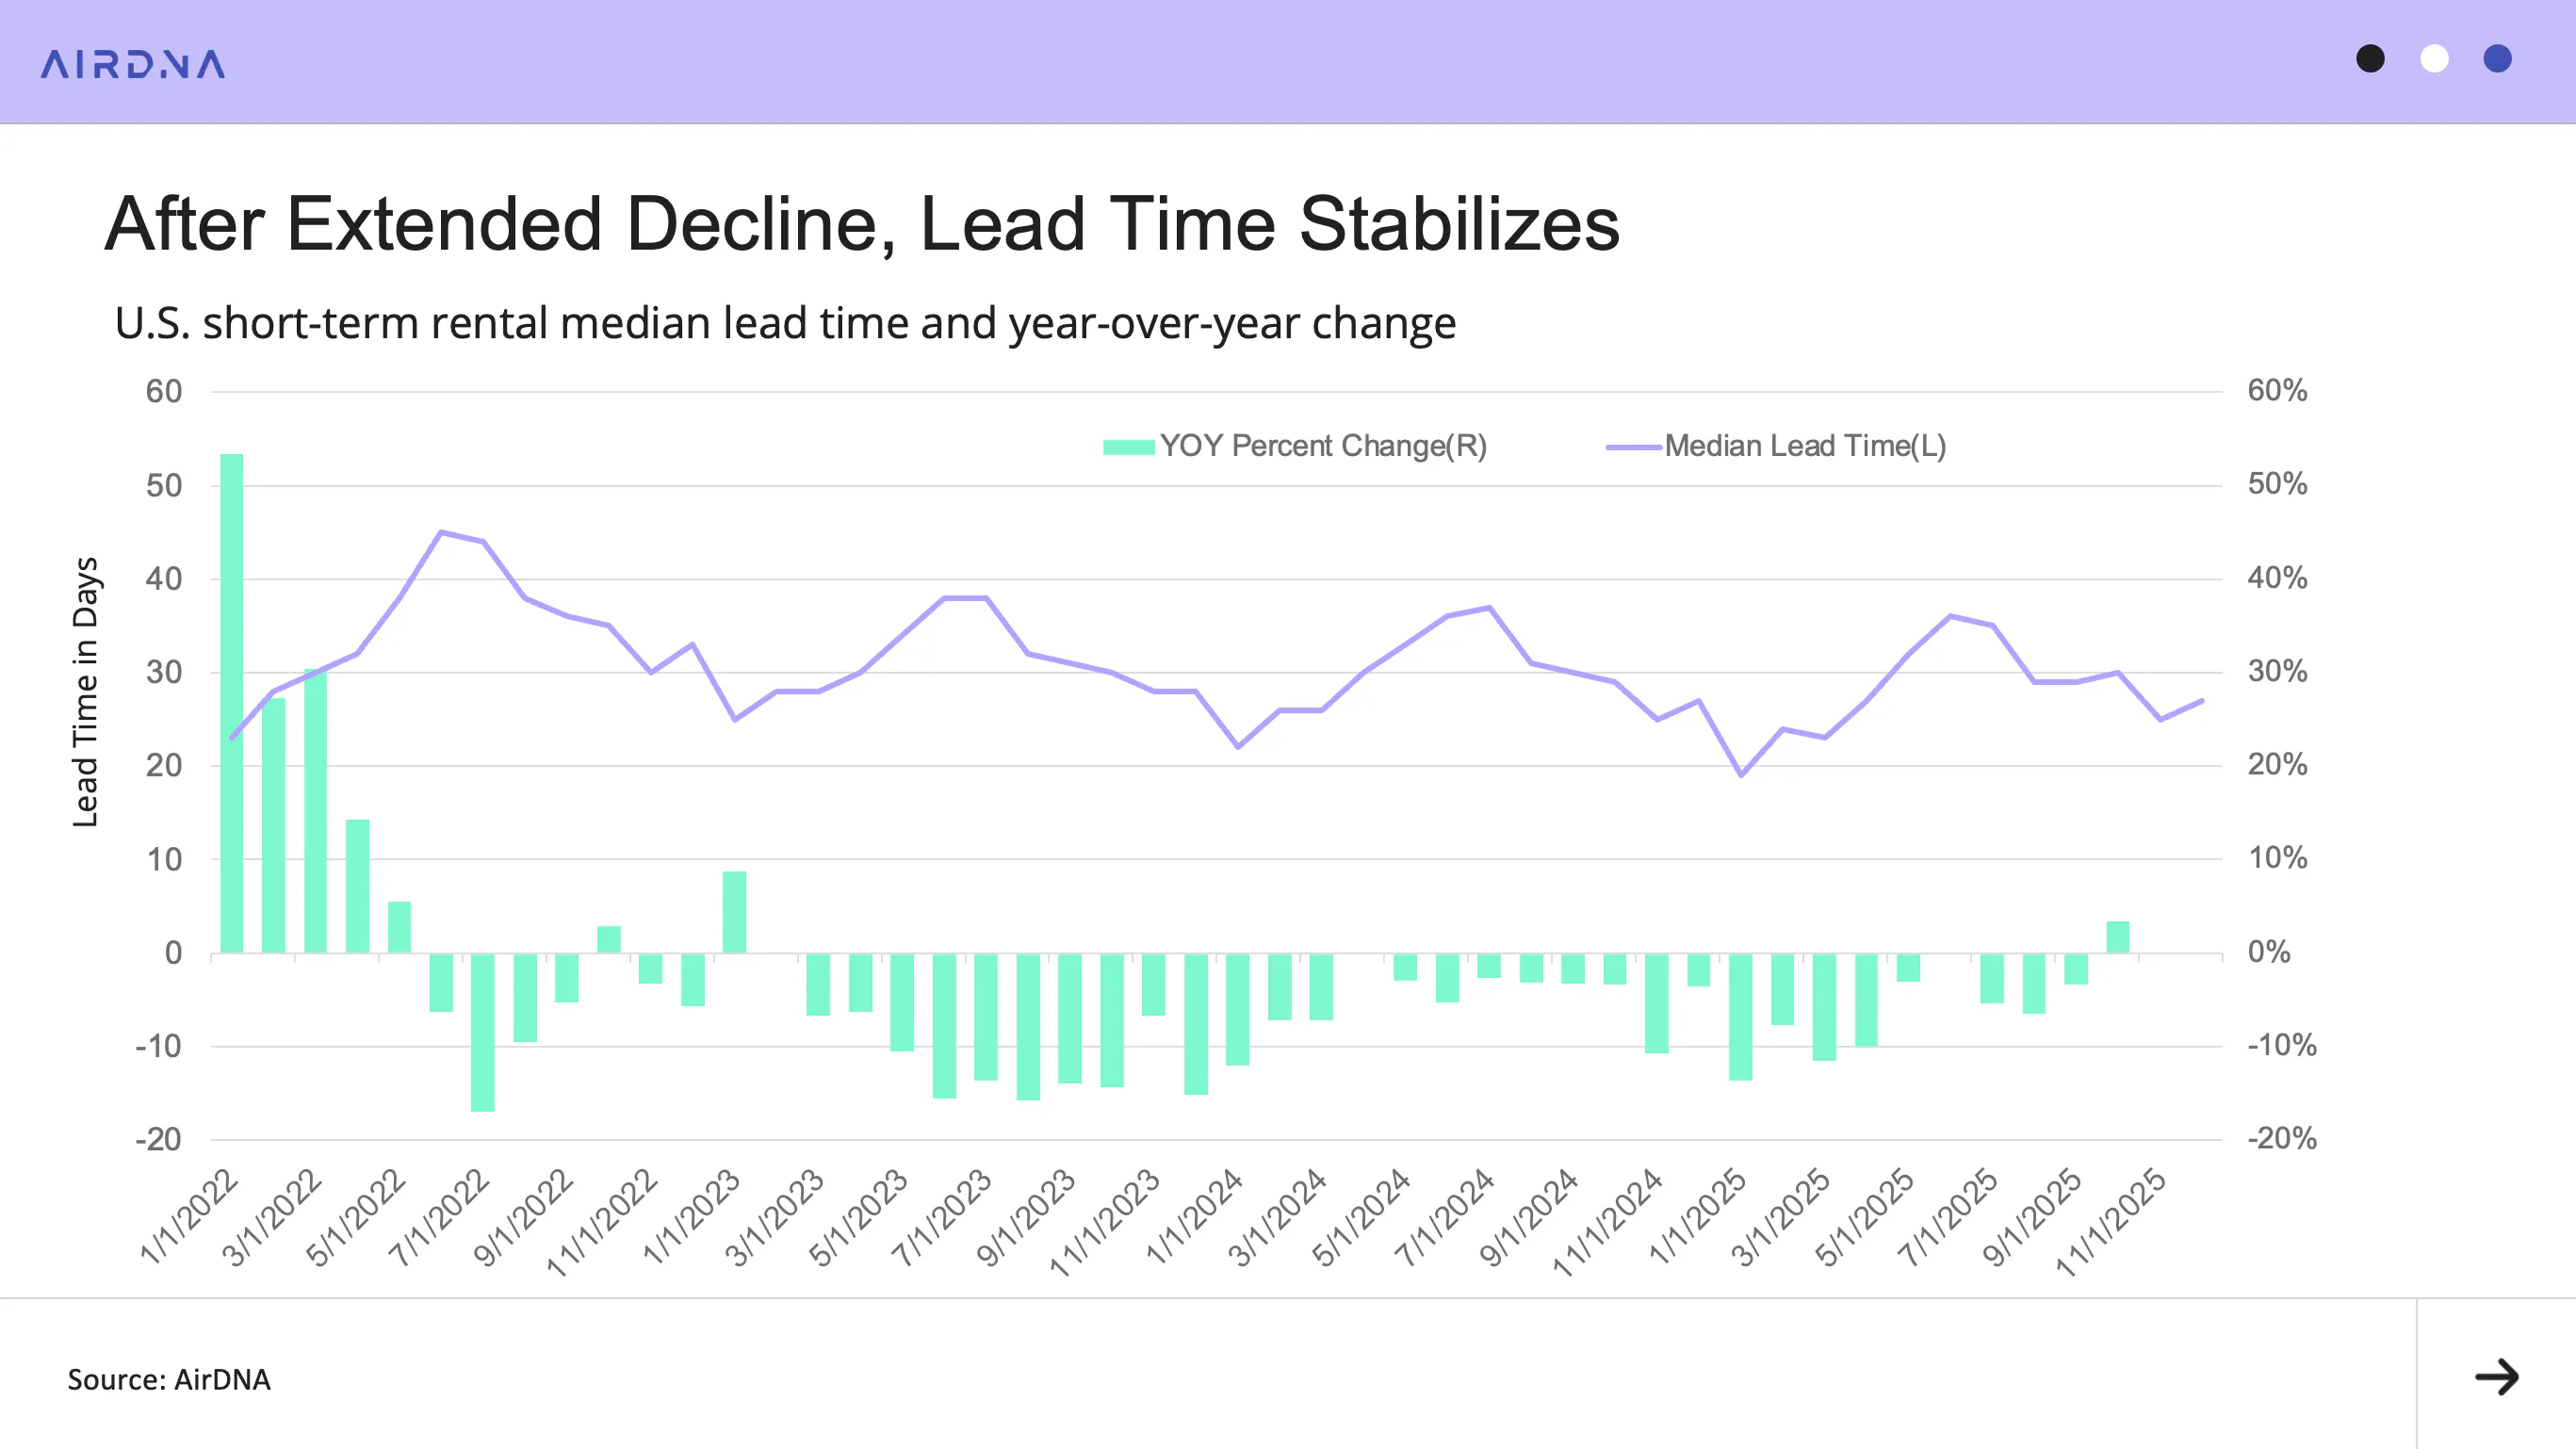
2025 ended with what may be an early indication of trends shaping 2026. Lead times for reservations, which had been declining almost continuously since mid-2022, appear to have stabilized in Q4. October posted the first meaningful year-over-year increase in lead times since January 2023.
While it remains too early to determine the future path of lead times, the prolonged decline over the past several years has often been attributed to lower occupancy levels and increasing familiarity with short-term rental booking among travellers.
If so, stabilizing occupancy and continued adoption of STRs may help lead times settle at more predictable levels. This would provide some relief for hosts by shortening the time required to fill listings and improving the accuracy of pacing forecasts. Shifts in lead times can otherwise make booking activity appear stronger or weaker than underlying demand conditions would suggest.
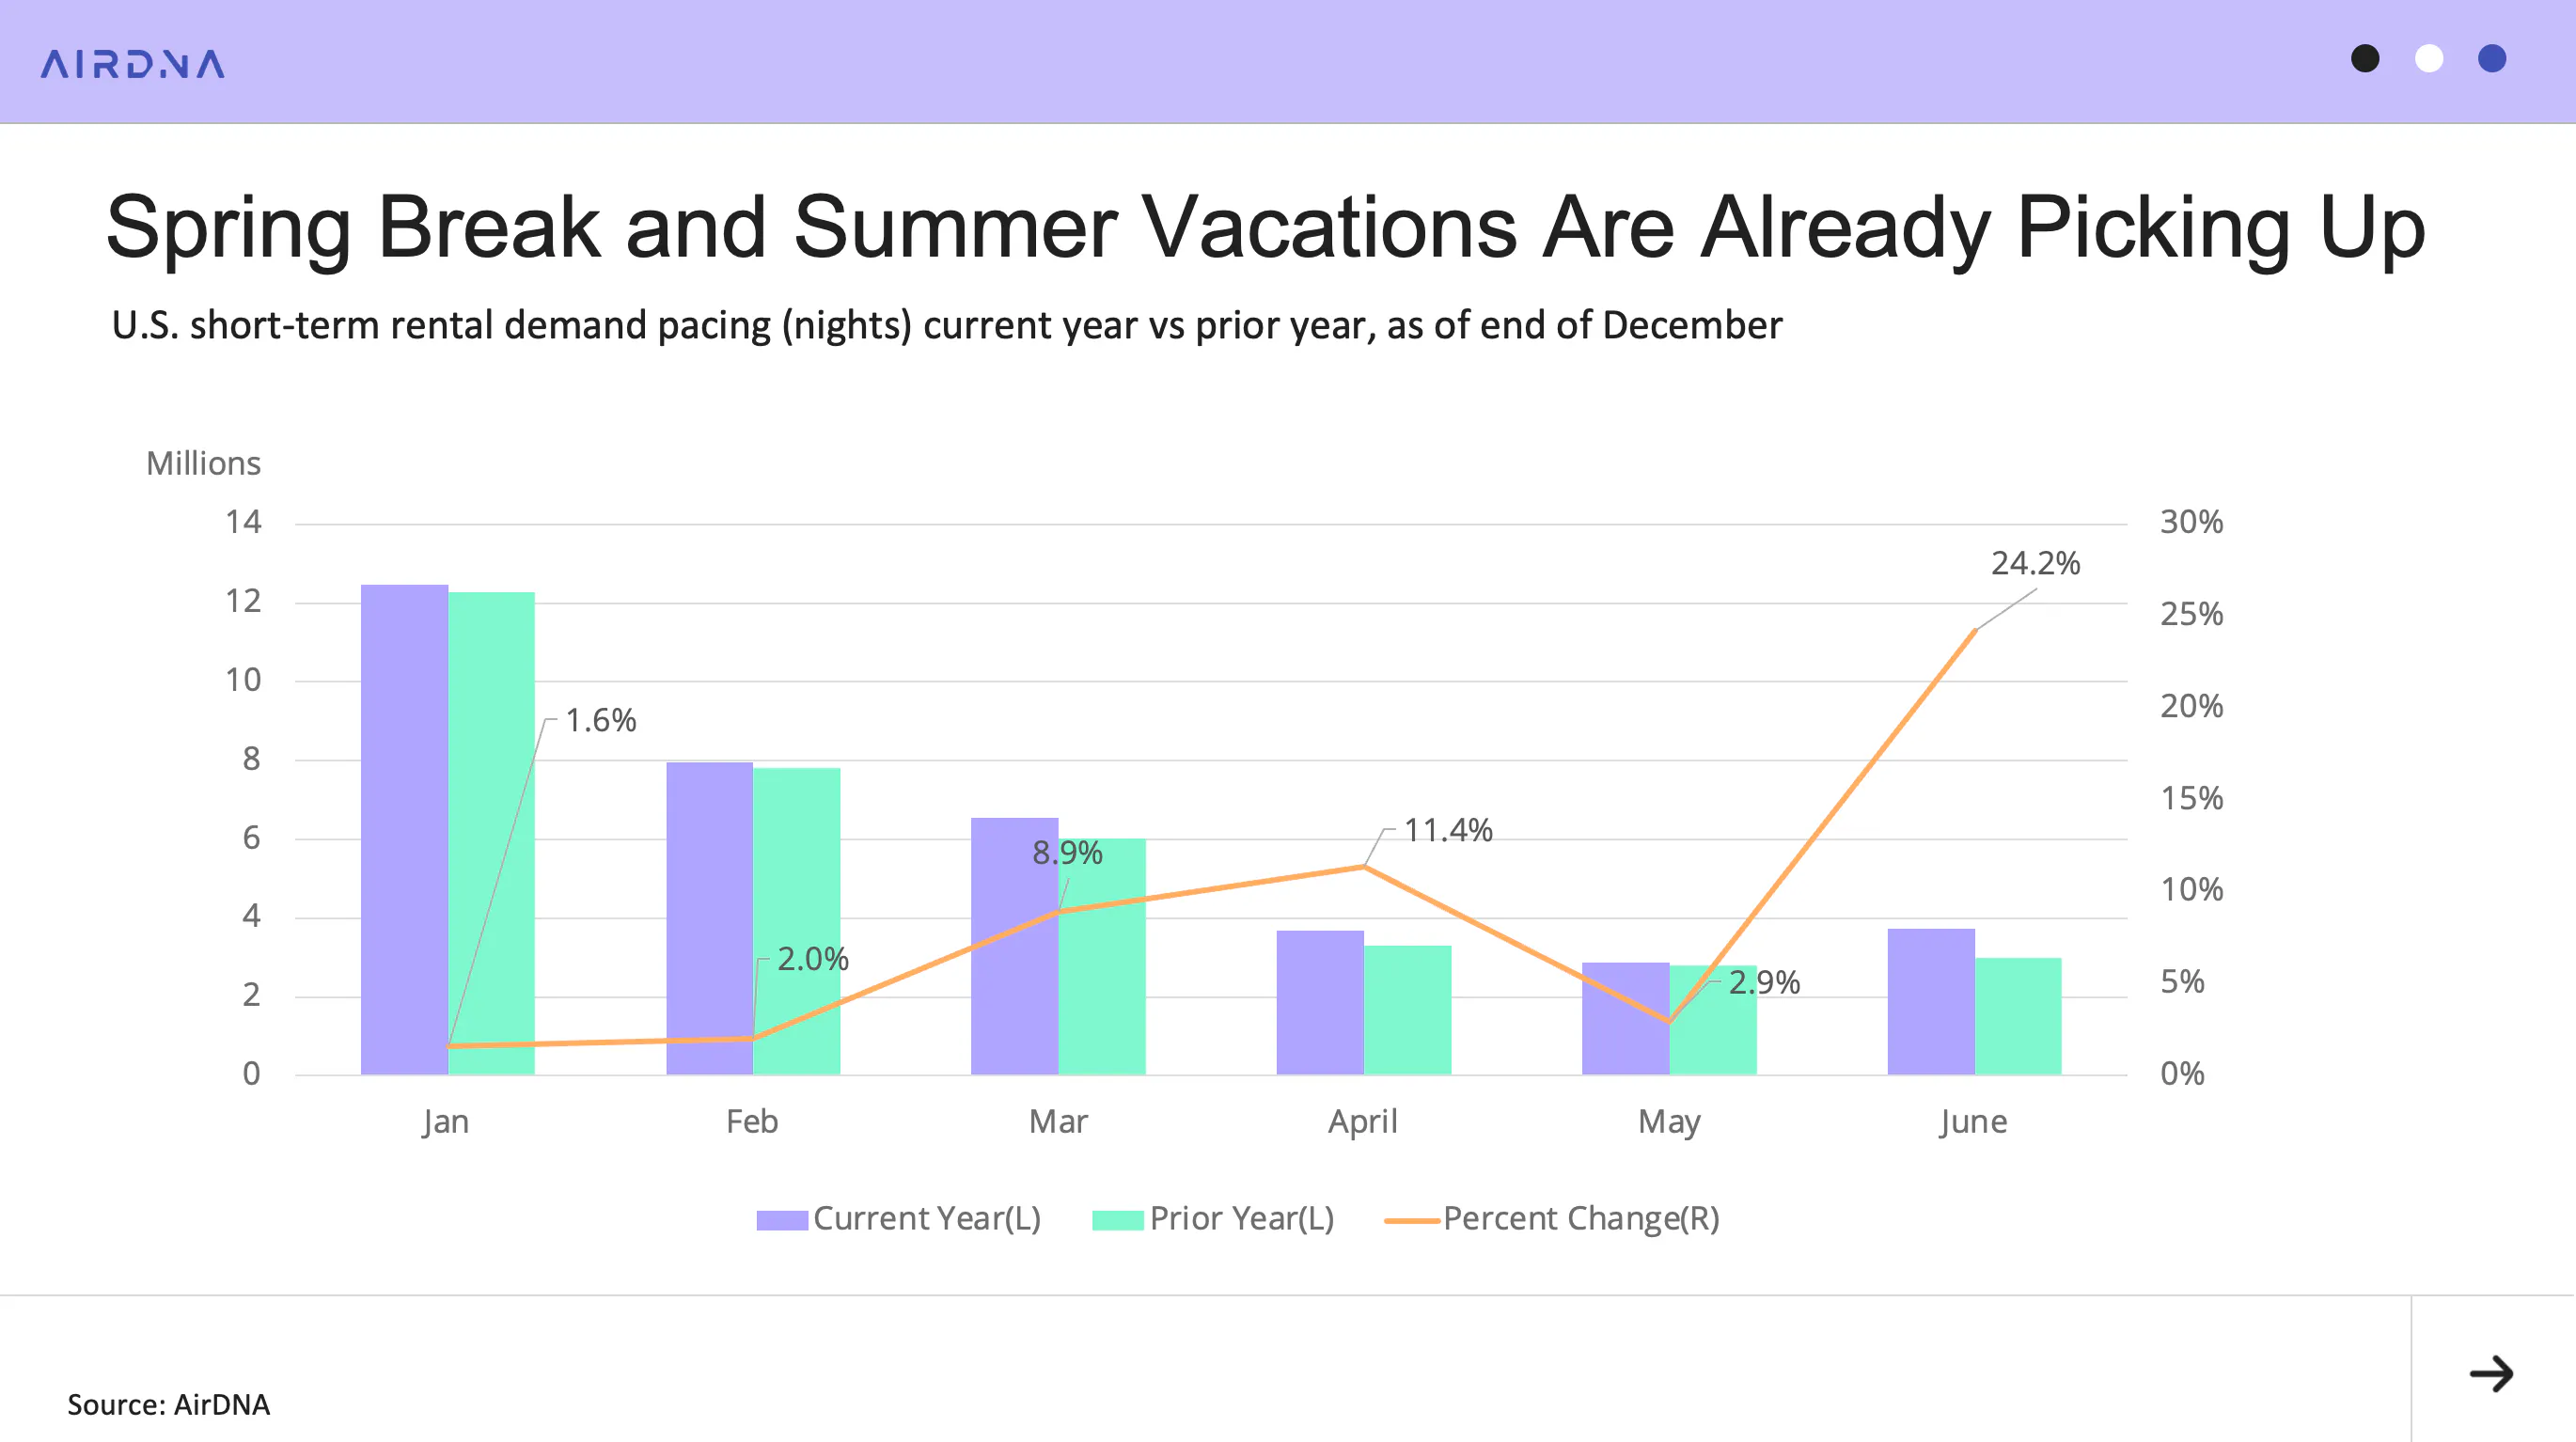
Turning to pacing, January and February currently appear positioned for muted demand growth. In contrast, March and April are showing significant gains compared to the same point last year, pointing to a strong Spring Break season. Spring Break has shifted on the calendar in recent years and fell predominantly in April in 2025. In 2026, March is pacing as the busiest month so far, although Easter’s early-April timing may split demand between the two months.
As of the end of December, both months were pacing strongly, with demand up 8.9% in March and 11.4% in April year-over-year.
June is pacing the fastest of any month. While pacing data this far in advance is typically volatile, a segment of travellers continues to book summer stays early, often immediately after the prior summer season. In many cases, these early bookings are driven by repeat guests taking advantage of early-booking discounts. June 2026 already has 3.7 million nights reserved in the U.S., representing a 24.2% increase over the same time last year.
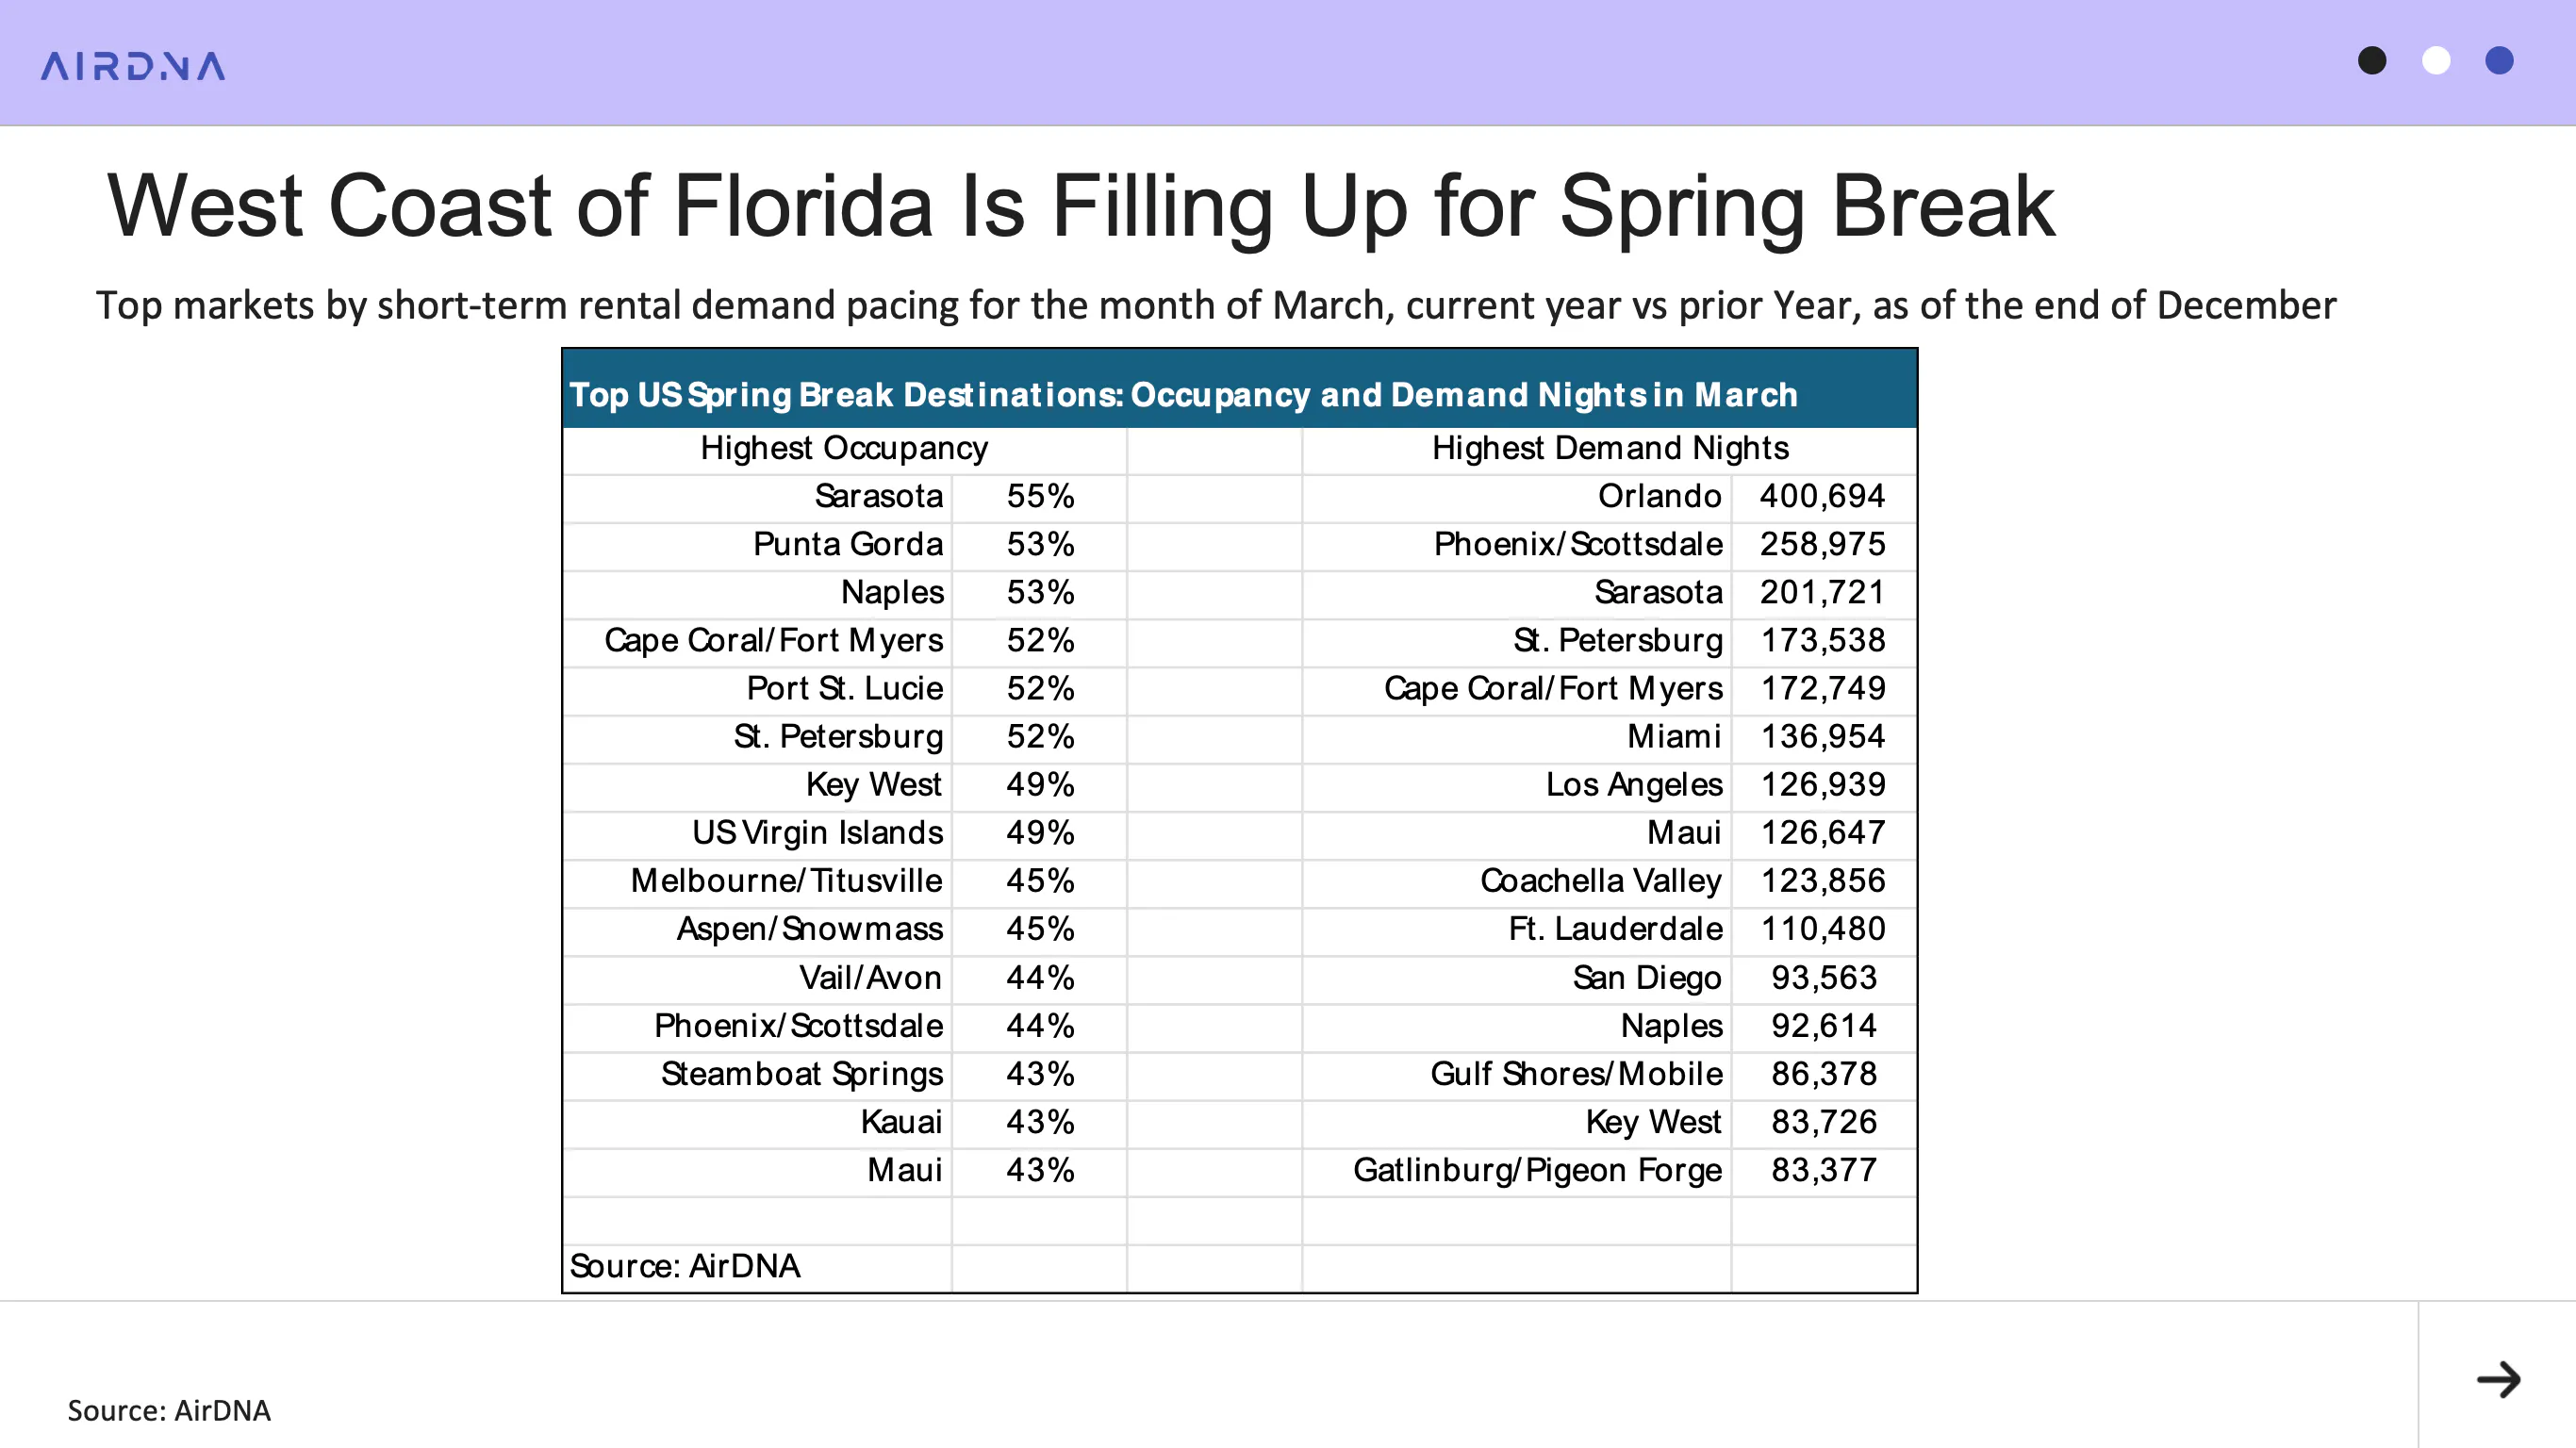
Looking specifically at Spring Break bookings, Gulf Coast resort markets are already showing strong demand, with several markets more than half occupied for March. Notably, while Florida’s Panhandle recorded some of the strongest year-over-year occupancy growth in 2025, markets along Florida’s West Coast currently occupy the top seven spots for March occupancy.
Late-season skiing also appears to be drawing Spring Break demand, with Colorado towns Aspen and Snowmass, Vail and Avon, and Steamboat Springs ranking among the top 15 markets by occupancy.
Among high-volume March markets, Orlando leads in total demand, followed by Phoenix and Scottsdale, Arizona, as popular snowbird destinations. The next three highest-demand markets are all located along Florida’s West Coast.
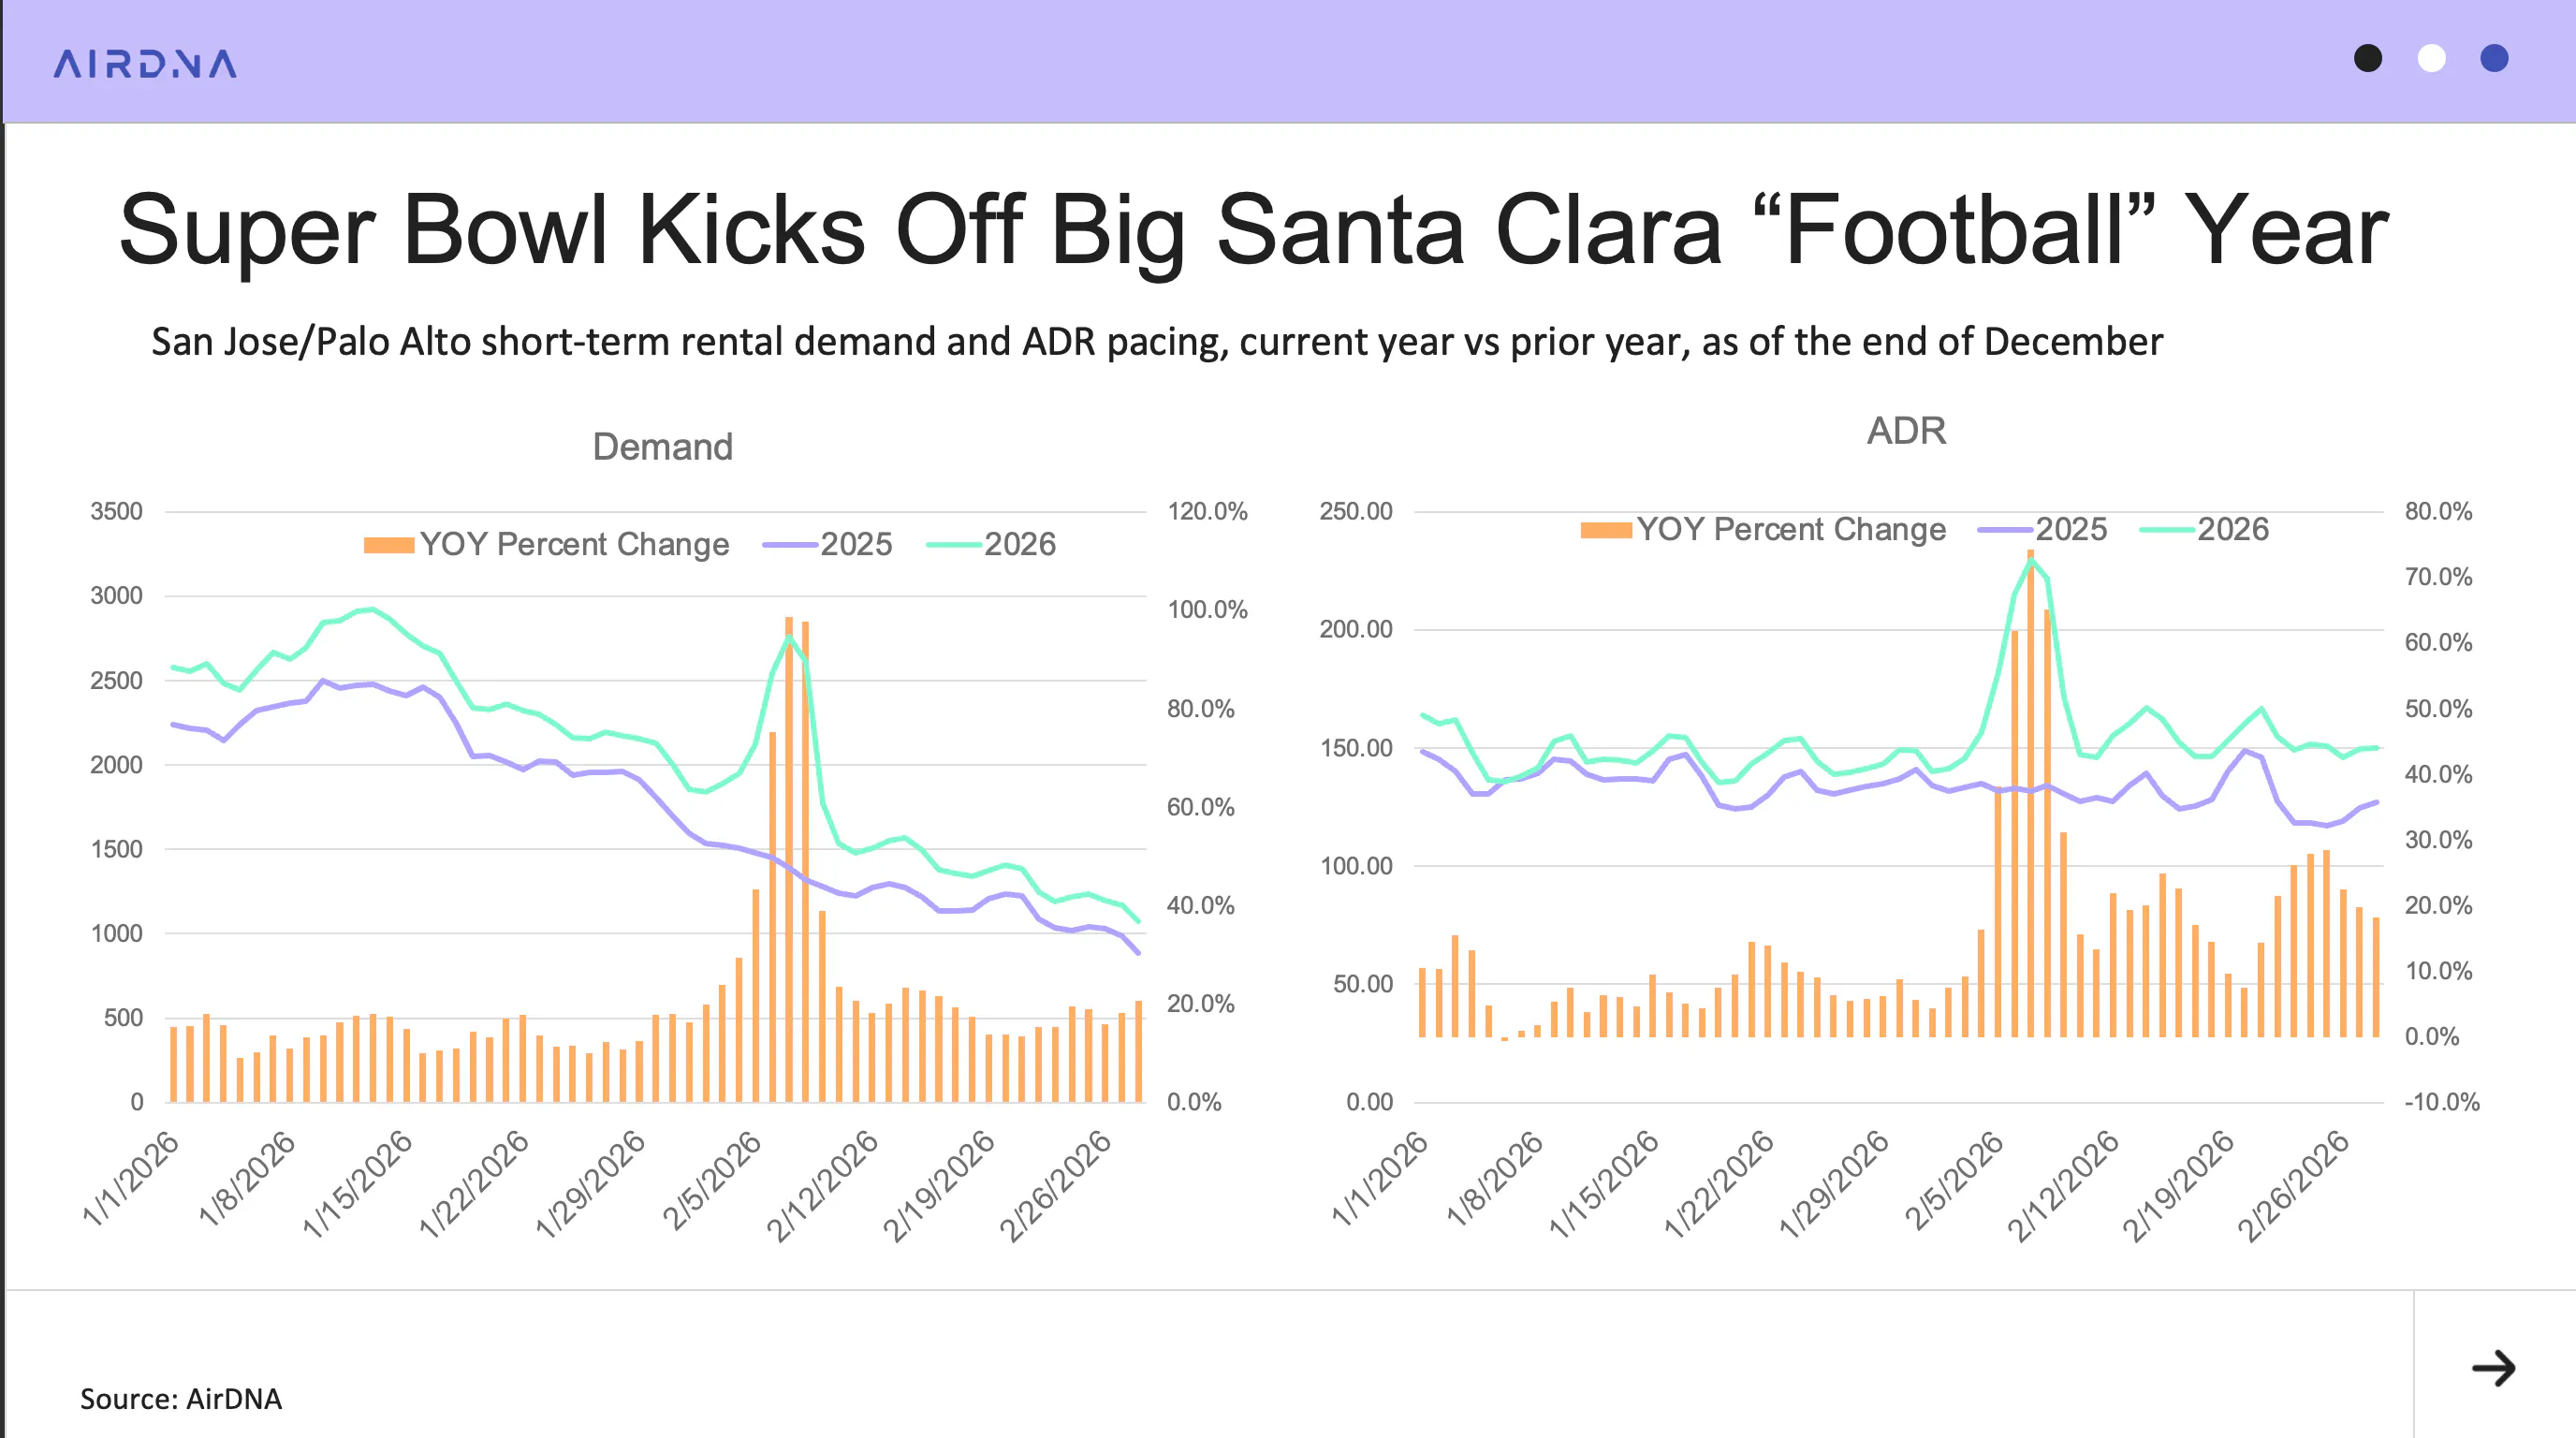
Finally, the San Jose and Palo Alto market in California is preparing to host the first of two major football events in 2026: the Super Bowl. Demand pacing for game day and the preceding day is nearly double that of last year. ADR for February 7th has climbed to $230, representing a 74.3% increase over the same date in 2024.
Later in the year, the market will also host World Cup matches, providing an opportunity to compare demand impacts across major sporting events.
ARTICLE SUMMARY
December closed out a year of uneven performance for the U.S. short-term rental market, with national occupancy remaining flat while results varied widely across markets and price tiers. Late year pricing momentum and strong early pacing for 2026 point to improving demand despite ongoing economic uncertainty.
Bram Gallagher
AirDNA Director of Economics and Forecasting
Bram Gallagher is an Economist at AirDNA, specializing in uncovering insights that drive smarter short-term rental decisions. He put his Ph.D. in Economics from the University of Georgia to work researching and forecasting hotel data with CBRE prior to joining AirDNA, as well as teaching economics at a number of universities. In his spare time, Bram enjoys making wooden furniture with hand tools.