U.S. Review April 2025: Spring Break Lifts Bookings, but Tariff Caution Lingers
Published: May 14, 2025

Bram Gallagher
Key Takeaways:
- April demand rose 10.1% year-over-year, helped by Spring Break timing and strong performance across all location types.
- RevPAR increased 12.7%, the fastest growth since November 2024, driven by rising occupancy and steady ADR gains.
- Supply growth remained modest at 4.0%, with new listings declining slightly and investment activity staying subdued.
- Resort markets outperform urban areas in forward occupancy pacing, as budget-conscious travelers hold back in cities.
February and March both saw weaker demand growth, at least on paper, due to calendar quirks. February gained an extra day thanks to the leap year, while a calendar shift pushed many spring break and Easter holidays into April, inflating April’s numbers at the expense of the prior two months. Distortions aside, though, April delivered a blockbuster performance.
Demand nights in April grew at more than 10% year-over-year (YOY), and revenue per available room (RevPAR) grew at 12.7%, the fastest rate since November 2024 and the second-fastest rate since February 2022.
Some of this uptick can be credited to the calendar shift. Still, the broader picture remains strong—even as uncertainty looms. Airbnb’s recent Q2 revenue forecast cited softening consumer travel demand and growing concerns over trade policy. Uncertainty is certainly the watchword this summer, but current performance suggests the short-term rental (STR) market remains on solid footing for now.
Economic Outlook
In April, economic discussion was dominated by the Trump administration’s sweeping tariff announcement on the 2nd—and the many revisions that followed. While current economic data remains relatively stable, most economists agree the full impact of these new tariffs won’t be felt until the second half of the year. As a result, today’s calm outlook may mask deeper uncertainty and potential fragility ahead.
Despite broader uncertainty, April’s performance was consistent. It may have even received a temporary boost from businesses and consumers “front-loading” purchases in anticipation of future price increases driven by tariffs.
Notably, Consumer Price Index (CPI) inflation cooled in March, dropping to 2.4% year-over-year (YOY) from 2.8% in February. This came even as inflation expectations ticked upward. According to the New York Federal Reserve’s Survey of Consumer Expectations, short-term inflation is now expected to reach 3.4%, with medium-term expectations at 3.2%. Other surveys, such as one from the University of Michigan, report even higher projections—but all point to a common theme: Most consumers believe inflation will rise through the rest of the year.
These expectations matter, especially in a tight labor market. The U.S. added 177,000 jobs in April, keeping unemployment at a relatively low 4.2%, according to the Bureau of Labor Statistics. As workers negotiate wages with inflation in mind, businesses may respond by raising prices to preserve margins—fueling a potential feedback loop. Elevated inflation can ultimately reduce real earnings and drive cutbacks in consumer spending.

At a Glance: Key U.S. STR Performance Metrics for April 2025
- Revenue per Available Rental (RevPAR) increased 12.7% year-over-year (YOY) to $161.93
- Available listings were 1.68 million, up 4.0% YOY
- Total demand (nights) rose 10.1% YOY
- Occupancy was 7.2% higher YOY at 53.4%
- Average Daily Rates (ADR) increased 5.1% YOY to $303.39.
- Repeat Rent Index (RRI) increased by 4.8% YOY
- Nights booked increased 10.3% YOY
Supply Slows to a Leisurely Pace
April brought only a modest increase in mortgage rates, rising from about 6.6% at the start of the month to 6.8% by the end. Oxford Economics expects home prices to climb 4–5% year-over-year, and with the Federal Reserve opting to hold rates steady at its May 7 meeting, the broader investment environment remains steady but somewhat uninviting. For now, there’s little sign of major monetary policy changes ahead.
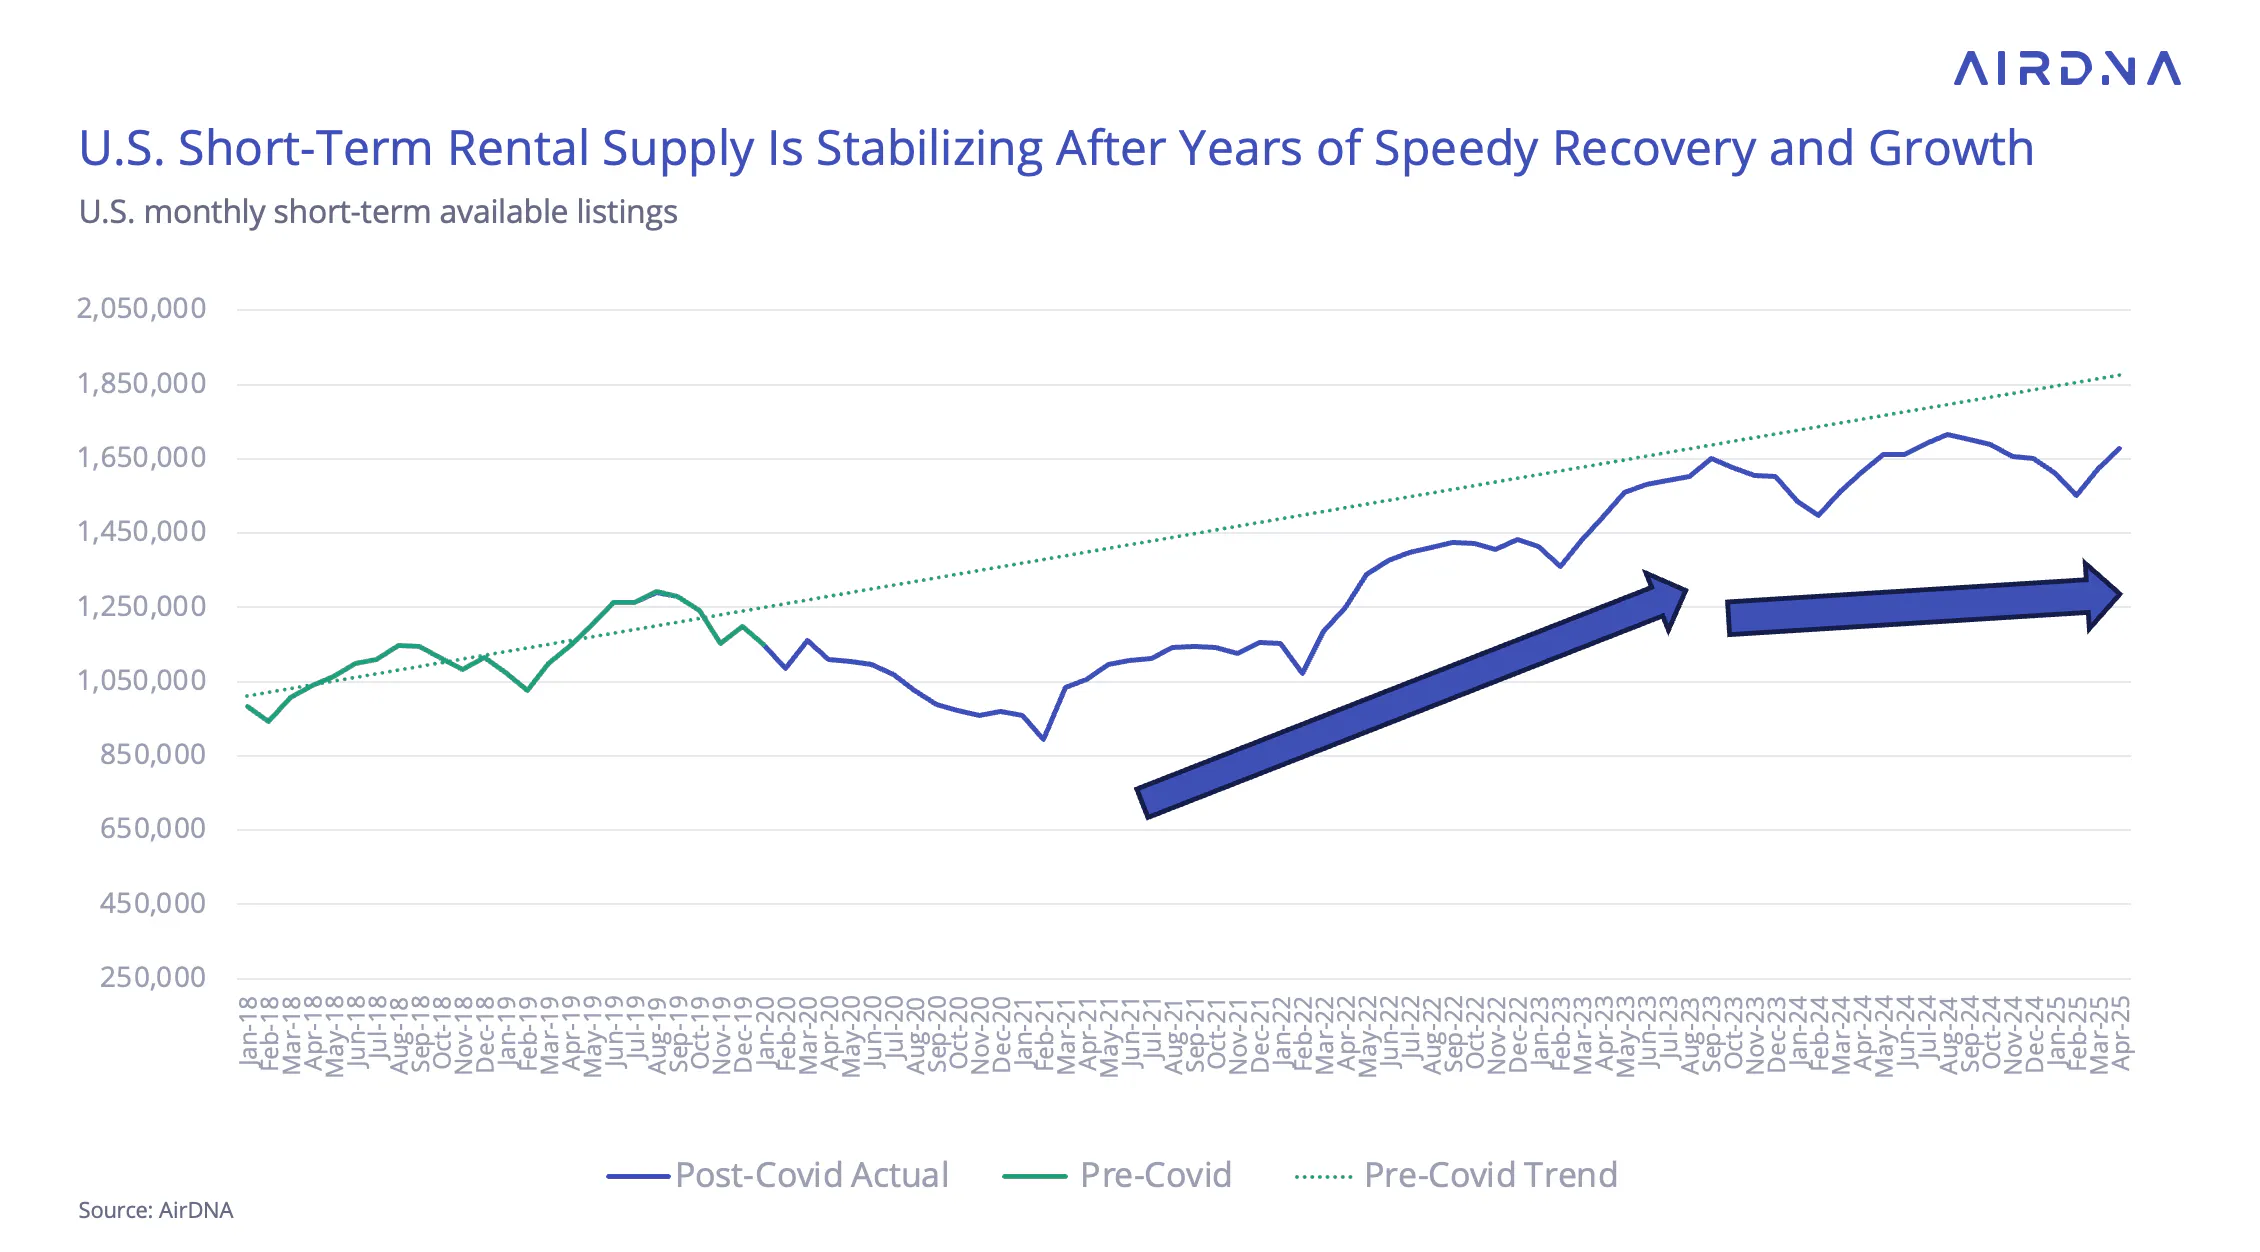
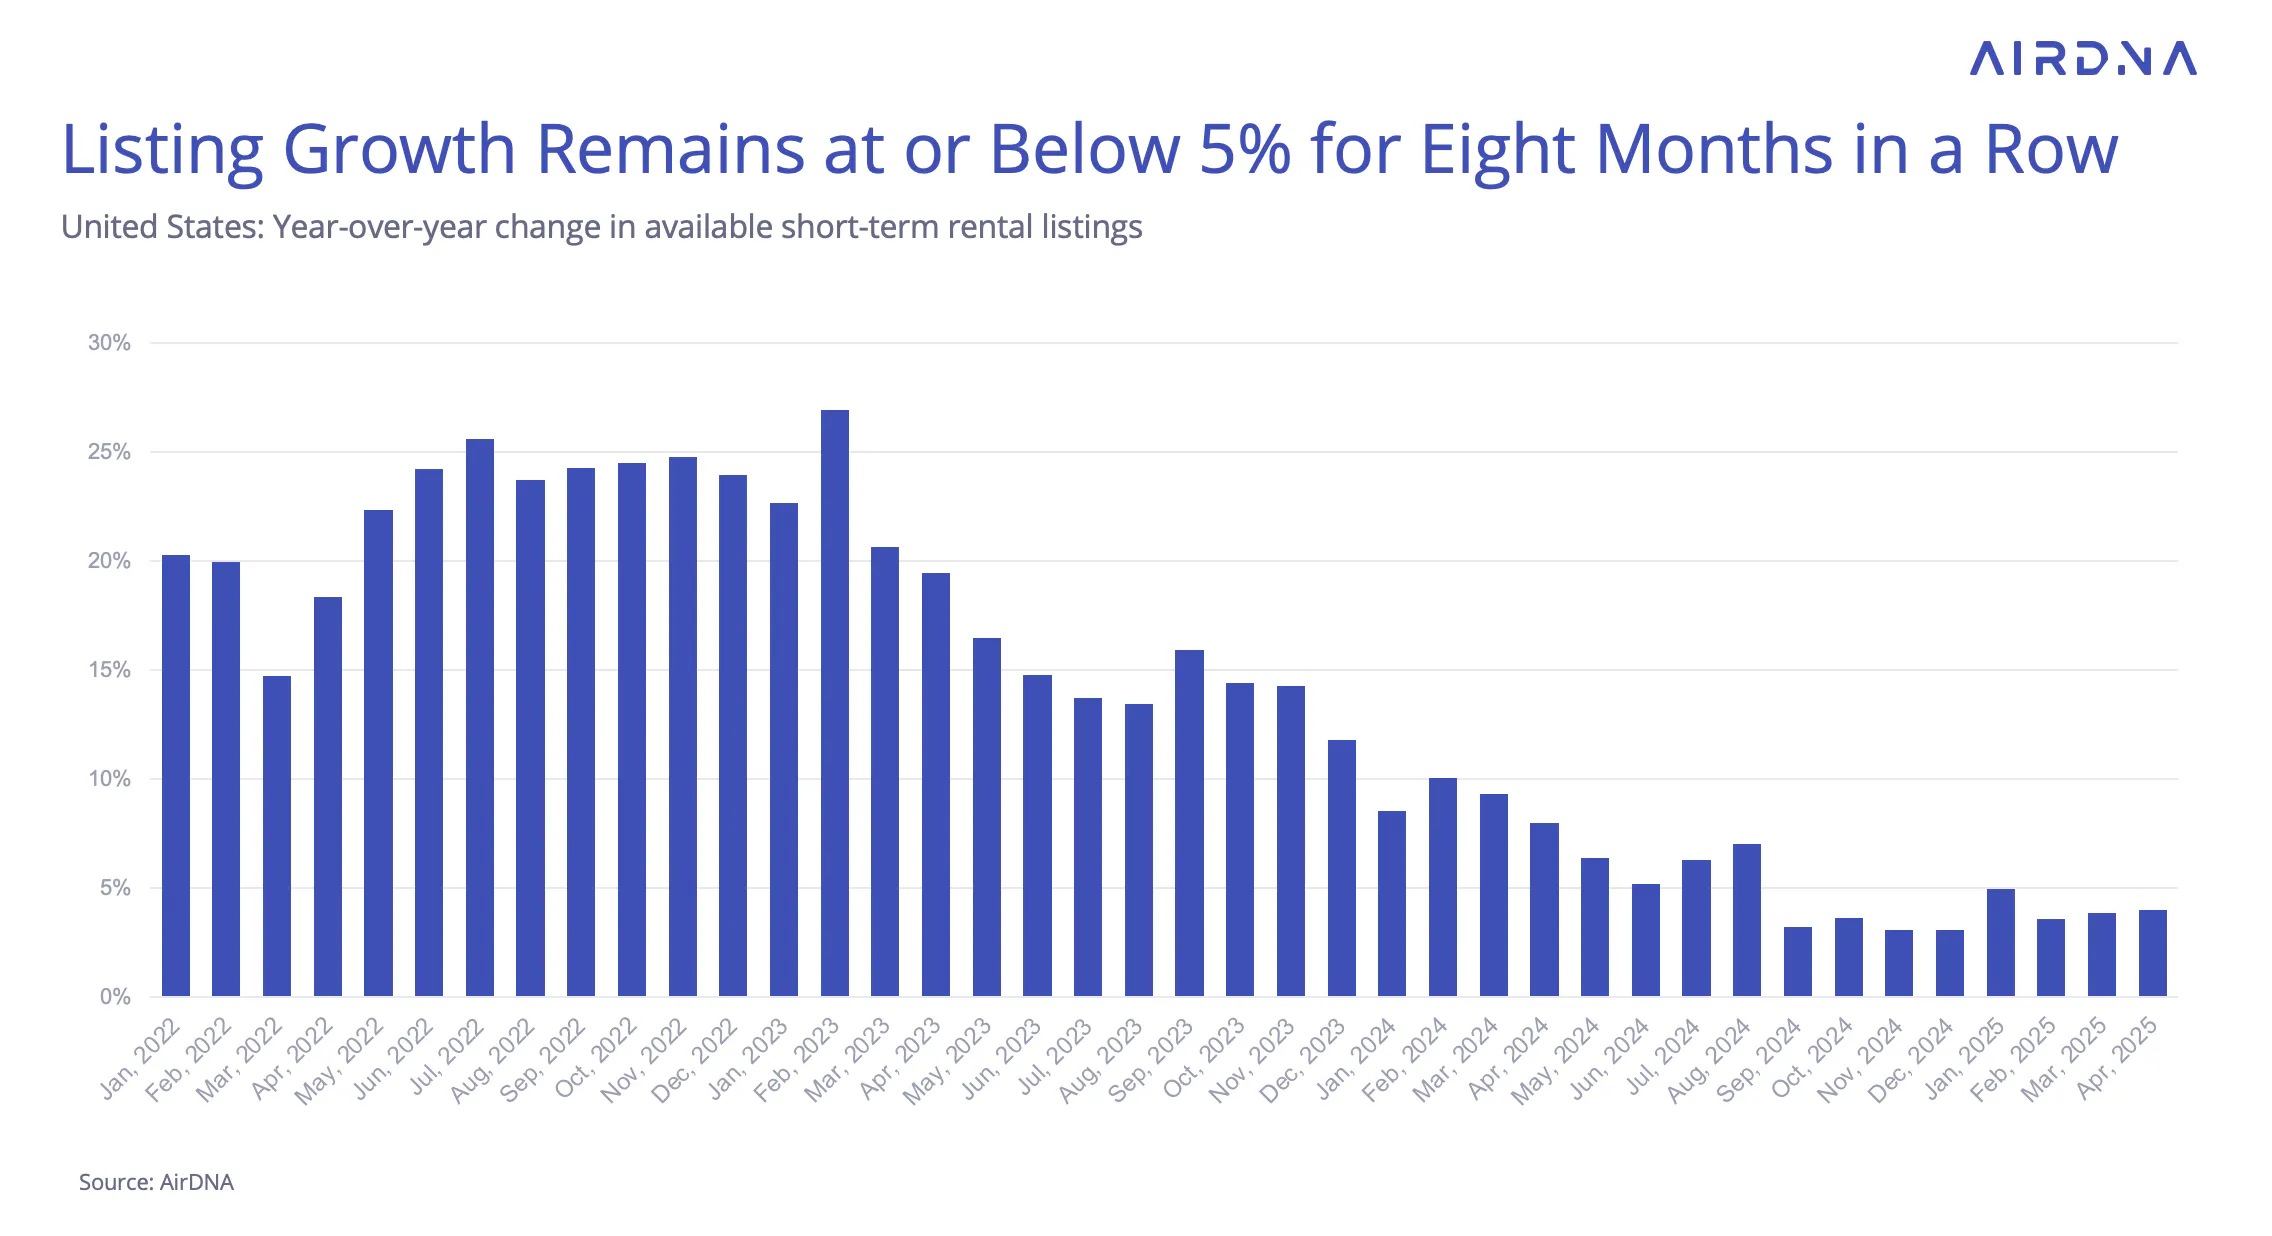
Against this backdrop, supply growth in the short-term rental market continues at a measured pace. While listings had previously outpaced pre-pandemic trendlines of 10–11% growth, they’ve since settled into a slower rhythm. For eight consecutive months, year-over-year growth has hovered between 3–5%, including April’s 4.0% gain.
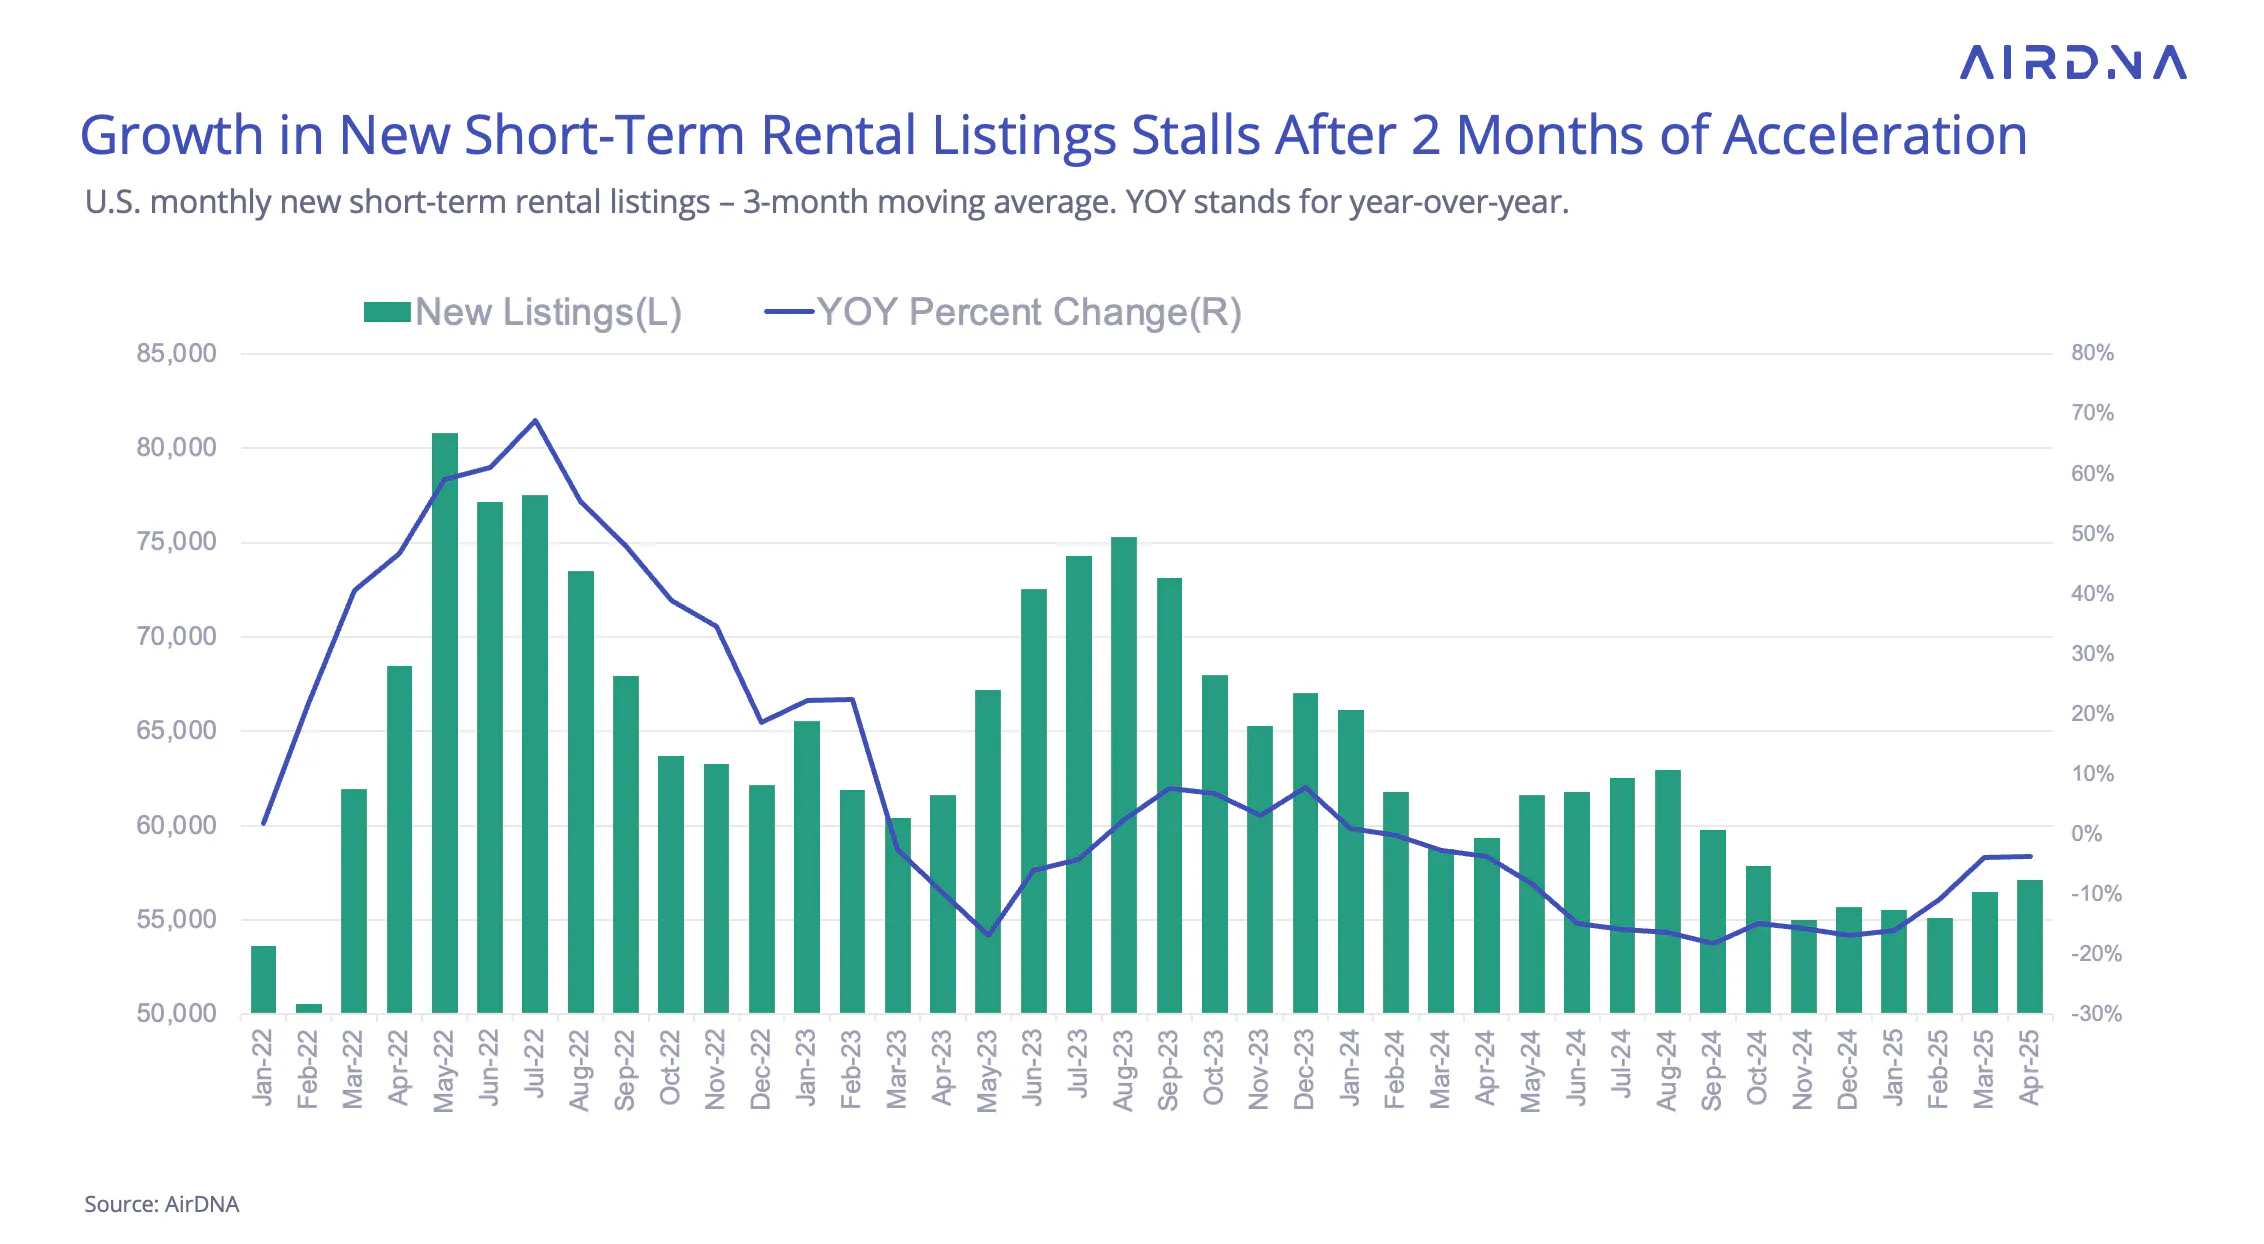
New listings had shown some momentum earlier in the year, with growth nearly matching 2024 levels in February and March. But that progress stalled in April. New listings declined 3.7% year-over-year—a slight shift from March’s -3.8%, but still trending downward.
Demand and Bookings
April marked a return to double-digit demand growth, with total nights booked up 10.1% year-over-year.
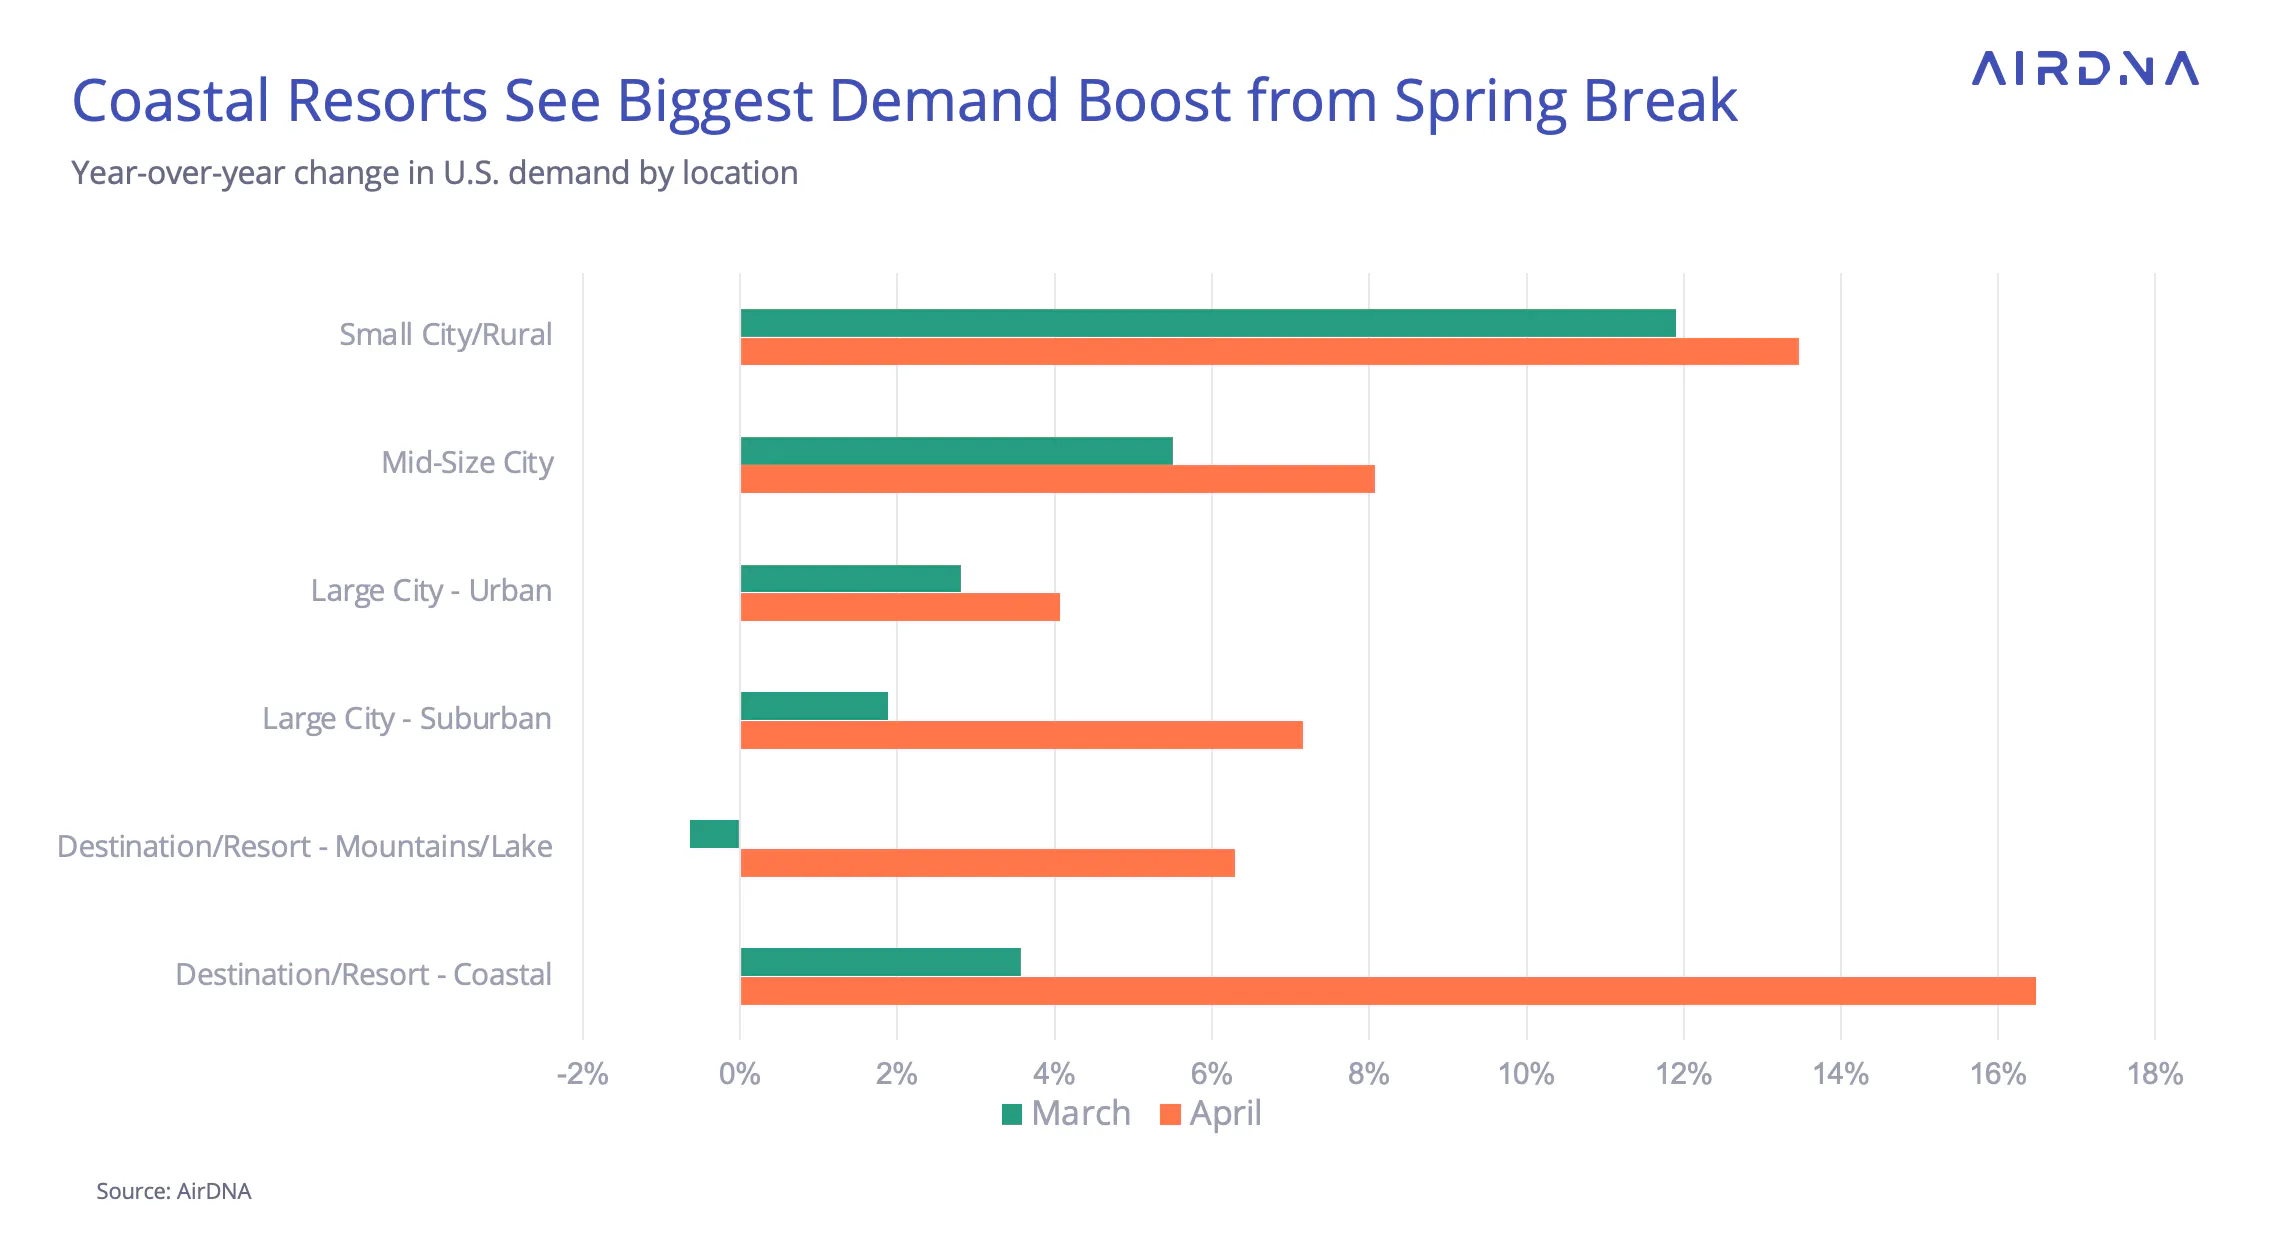
The timing of Spring Break and Easter holidays—shifted later this year—combined with mild weather to drive strong performance across nearly all destination types. Coastal resorts, in particular, saw noticeable gains as travelers headed back to the beach.
This made April the second-strongest month for demand growth so far in 2025, just behind January’s 11.5% increase. To find a similar level of growth prior to that, we’d look back to August 2024—peak summer travel season during a period of renewed consumer confidence following inflation declines in 2023.
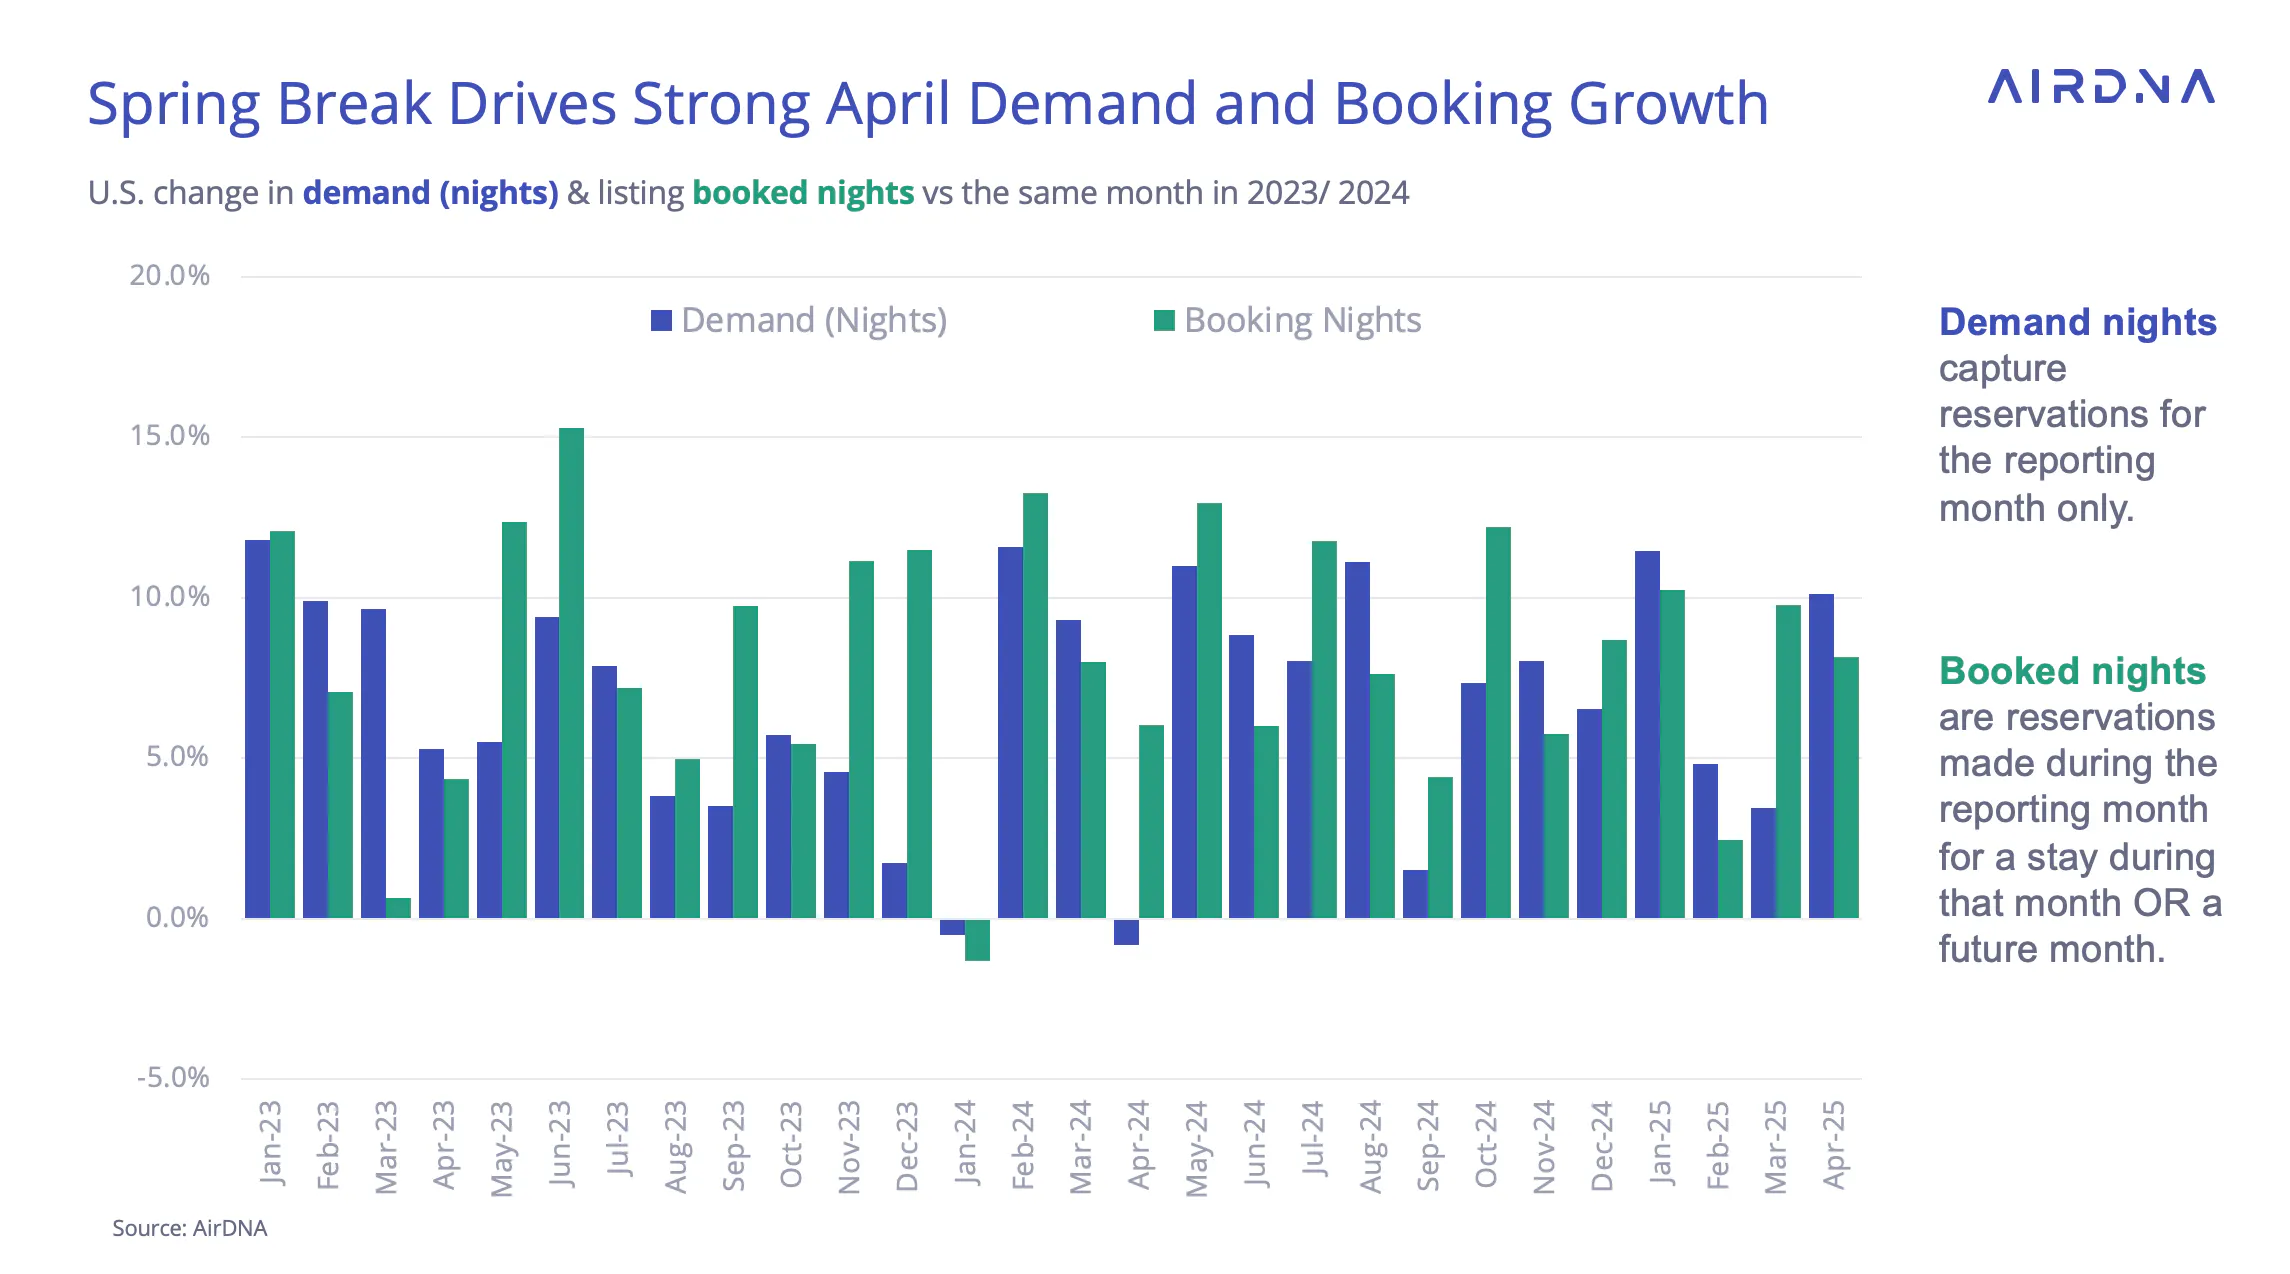
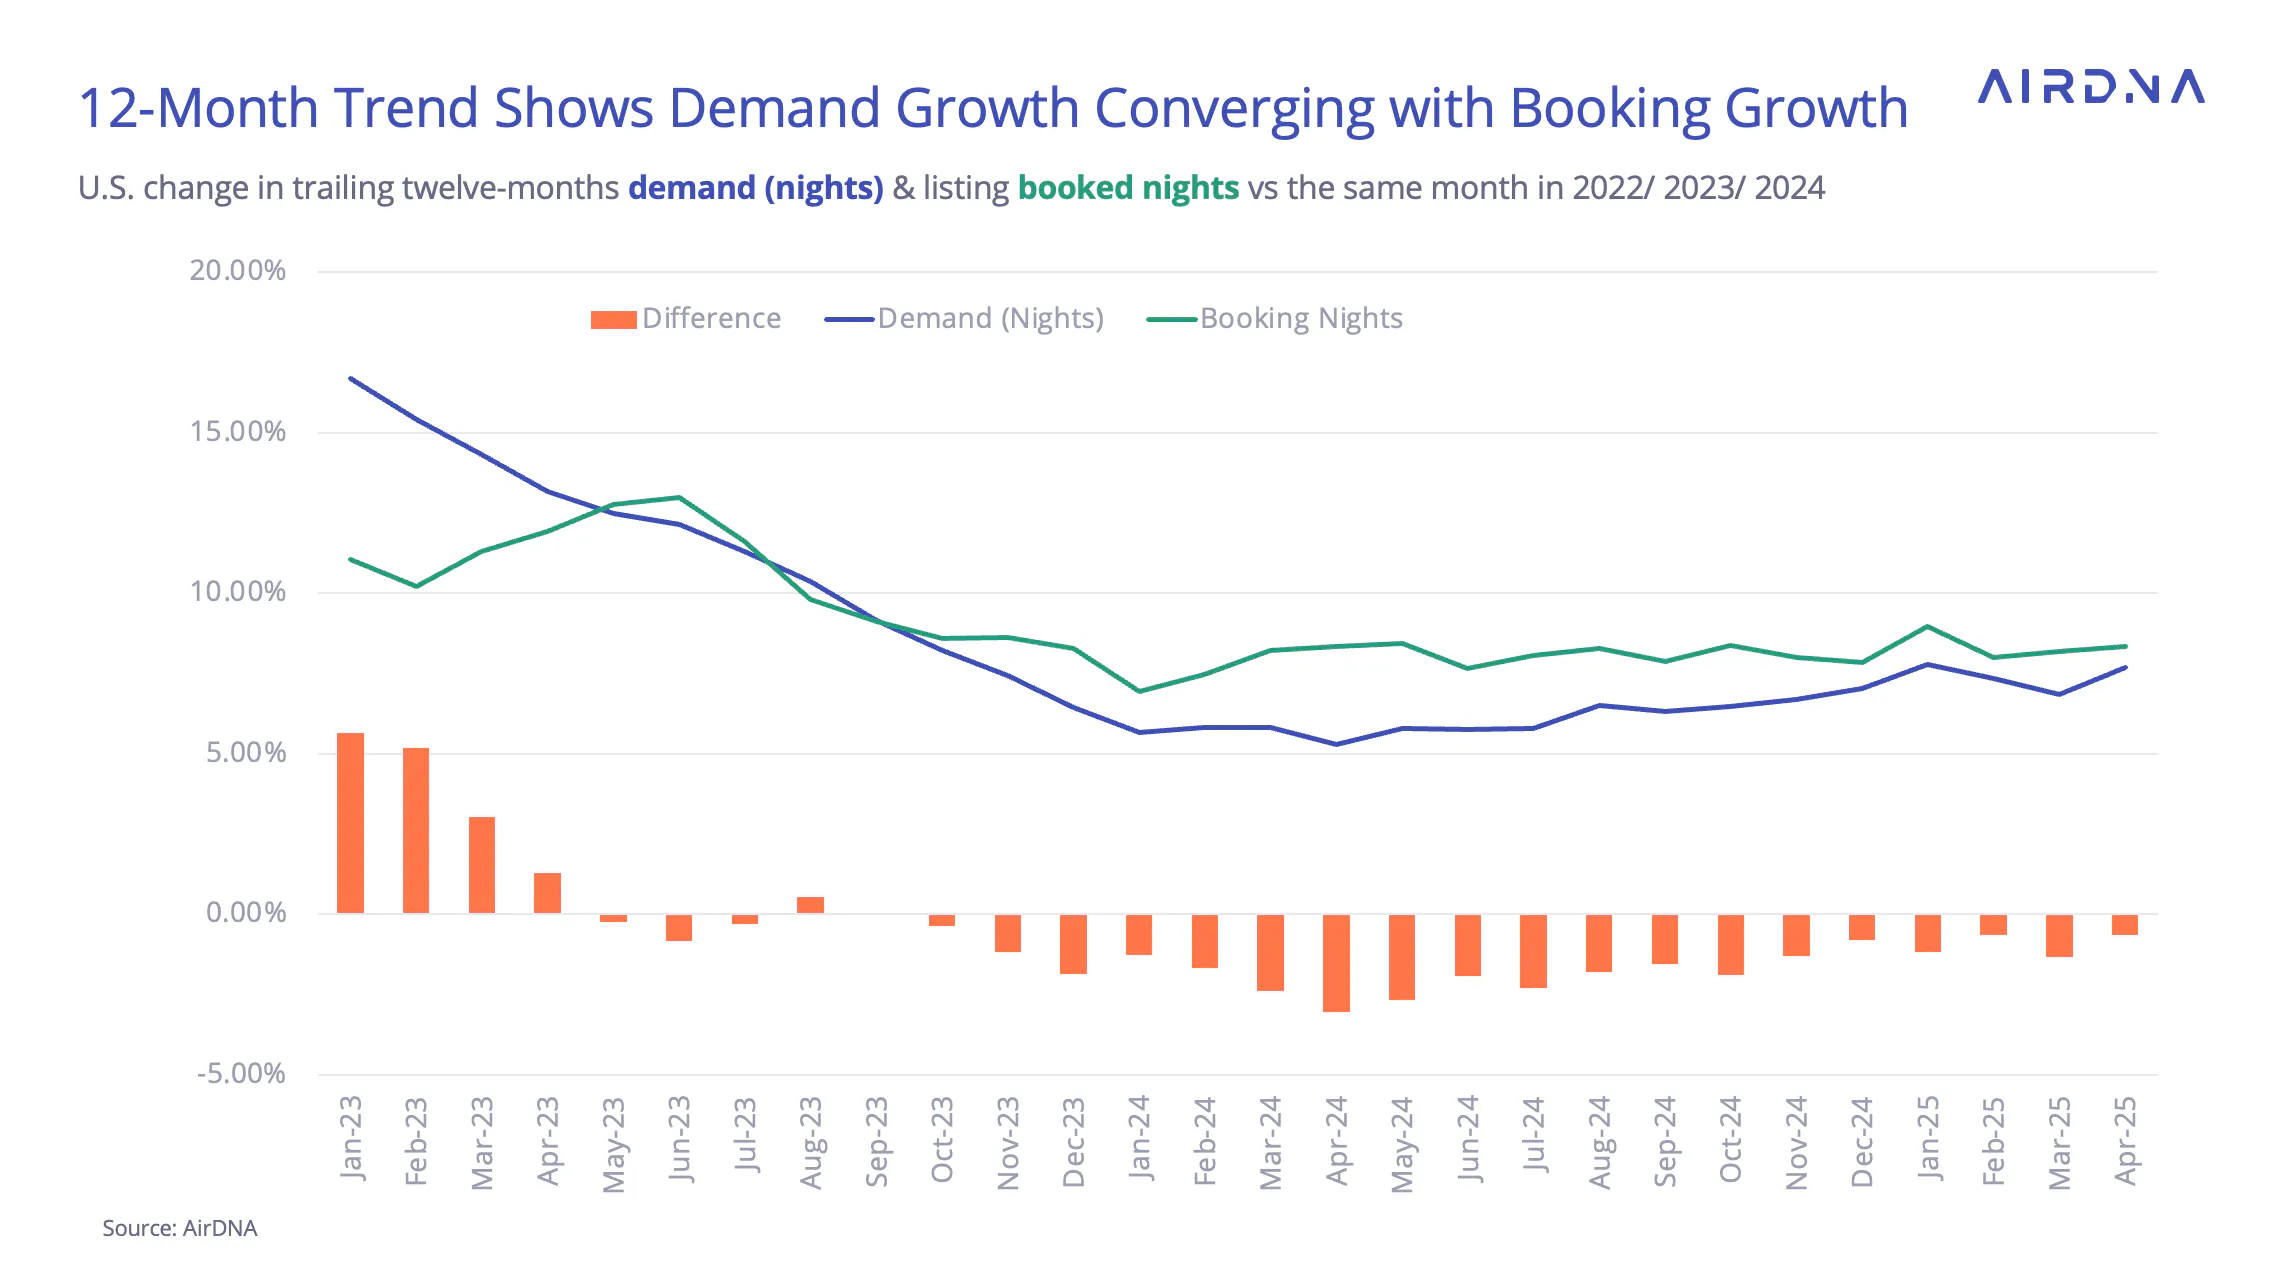
Future travel interest also remained strong. Booked nights grew by 8.2% year-over-year, continuing a stable upward trend. Because bookings reflect future travel plans, this metric often provides an early indicator of upcoming demand.
Looking at the trailing twelve-month averages, the gap between booked nights and realized demand has narrowed from over 3 percentage points last year to just 0.7 points in April — suggesting more room for modest demand acceleration ahead.
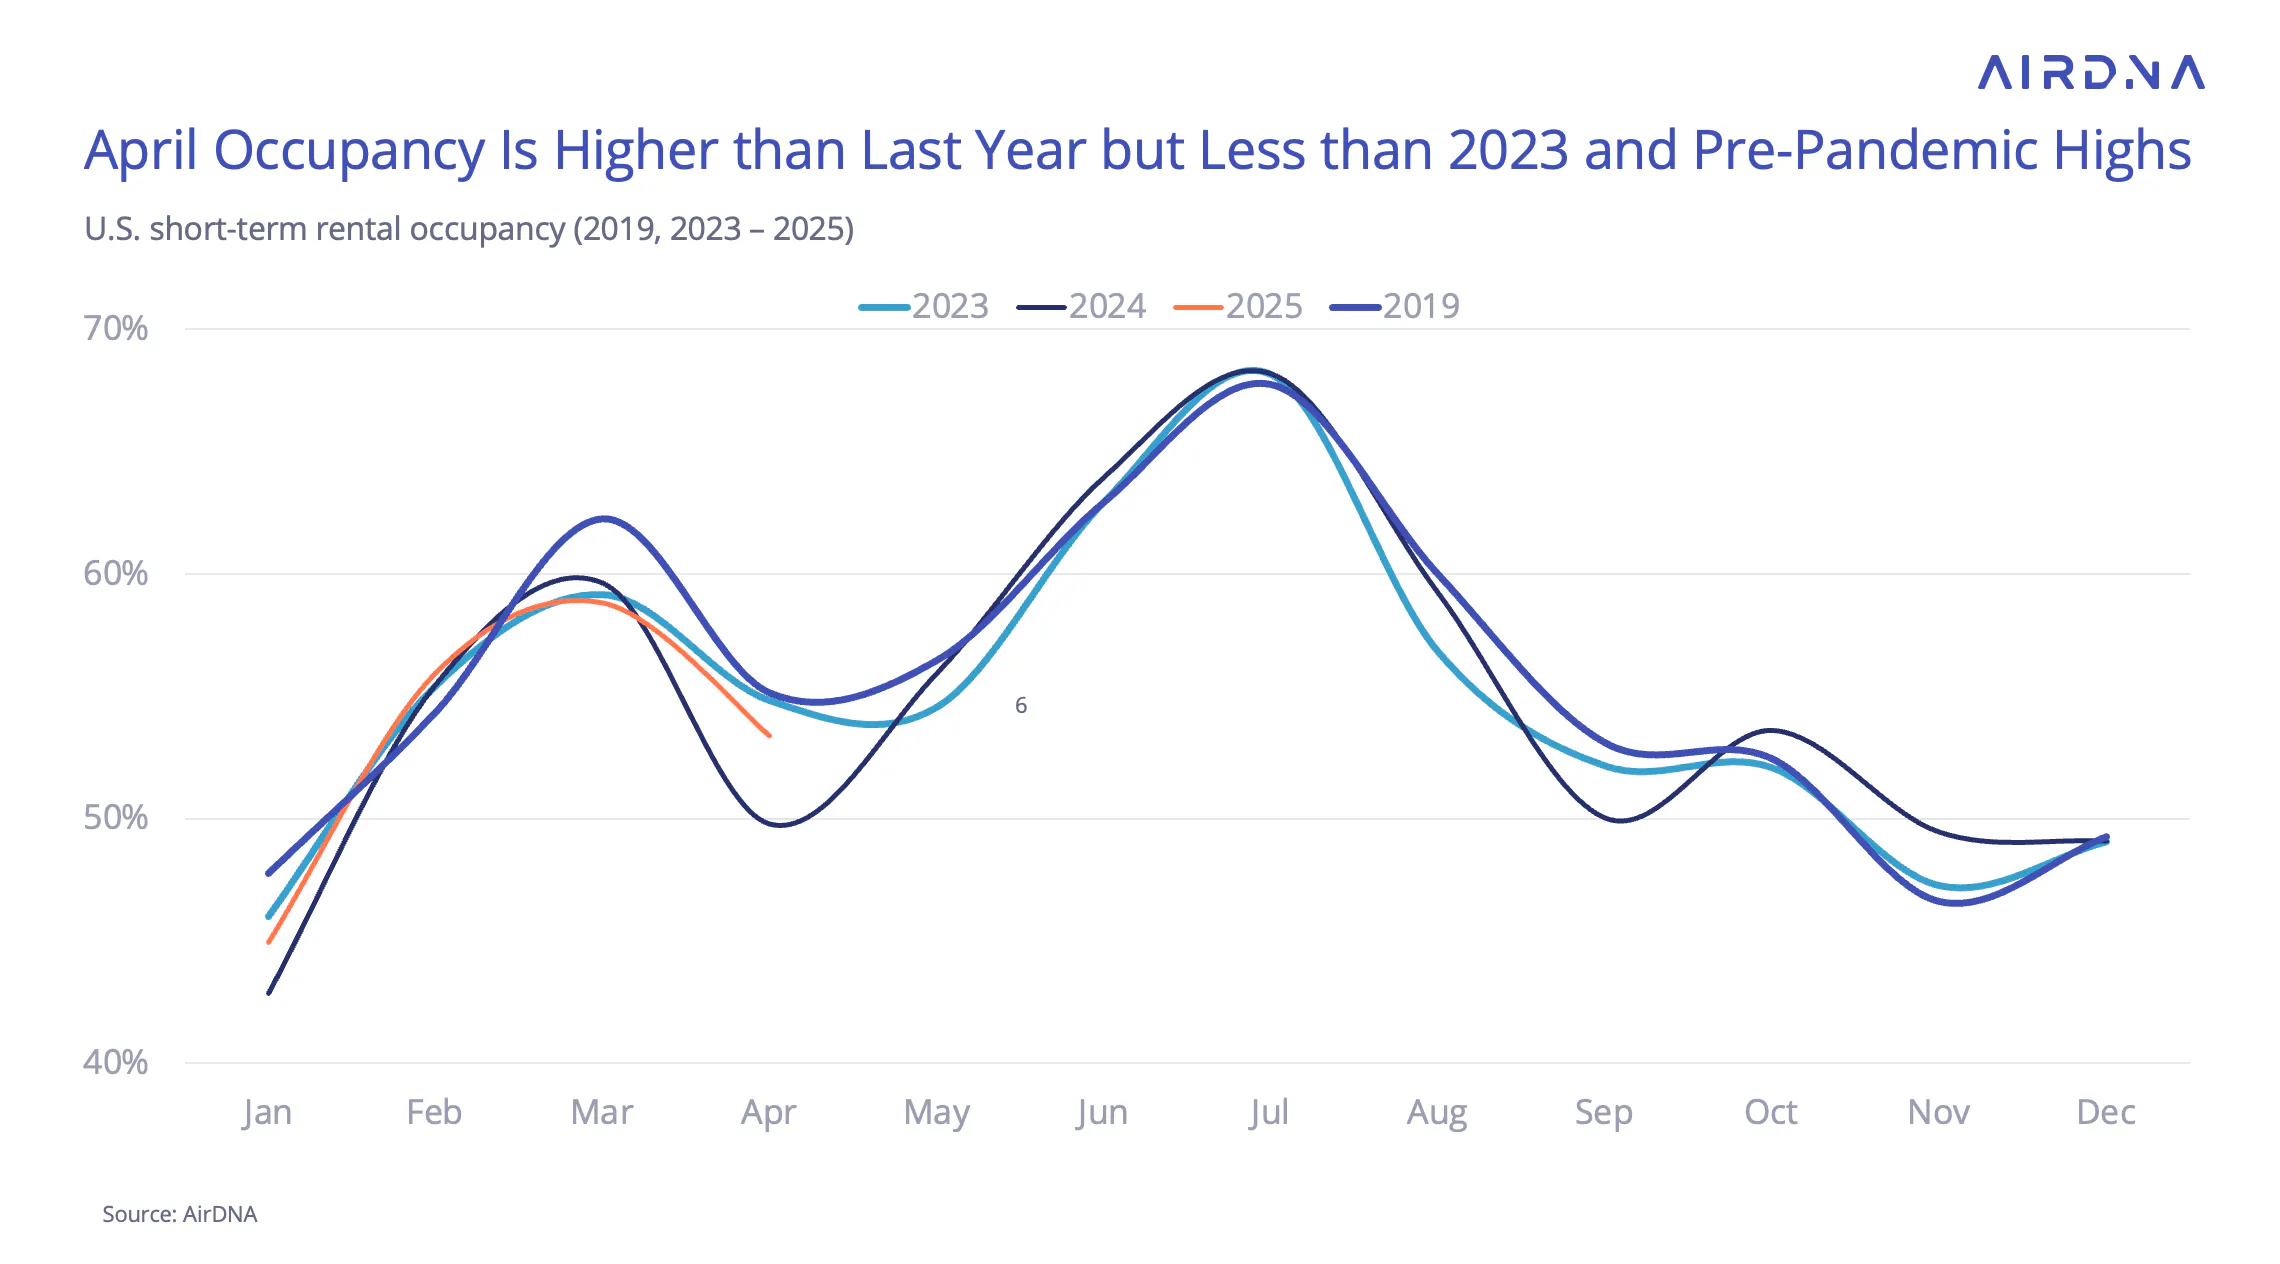
With demand up and supply growing slowly, occupancy rose by 7.2% in April to 53.4%. That’s a clear improvement over April 2024, although the timing of Spring Break this year made some increase likely. Still, occupancy remained slightly below April 2023 and pre-pandemic 2019 levels, which both sat around 56.5%. Outside of February, 2025 occupancy has been tracking just below 2023 levels.
Demand by Location Type
Across locations, coastal resorts led year-over-year demand growth with a 16.5% increase—also posting the strongest month-over-month improvement from March (+3.6%). Other segments saw notable gains as well, with small city and rural areas up 13.5% and mountain/lake resorts edging out urban areas to claim the fifth spot in overall growth rankings.
ADR and RRI Growth
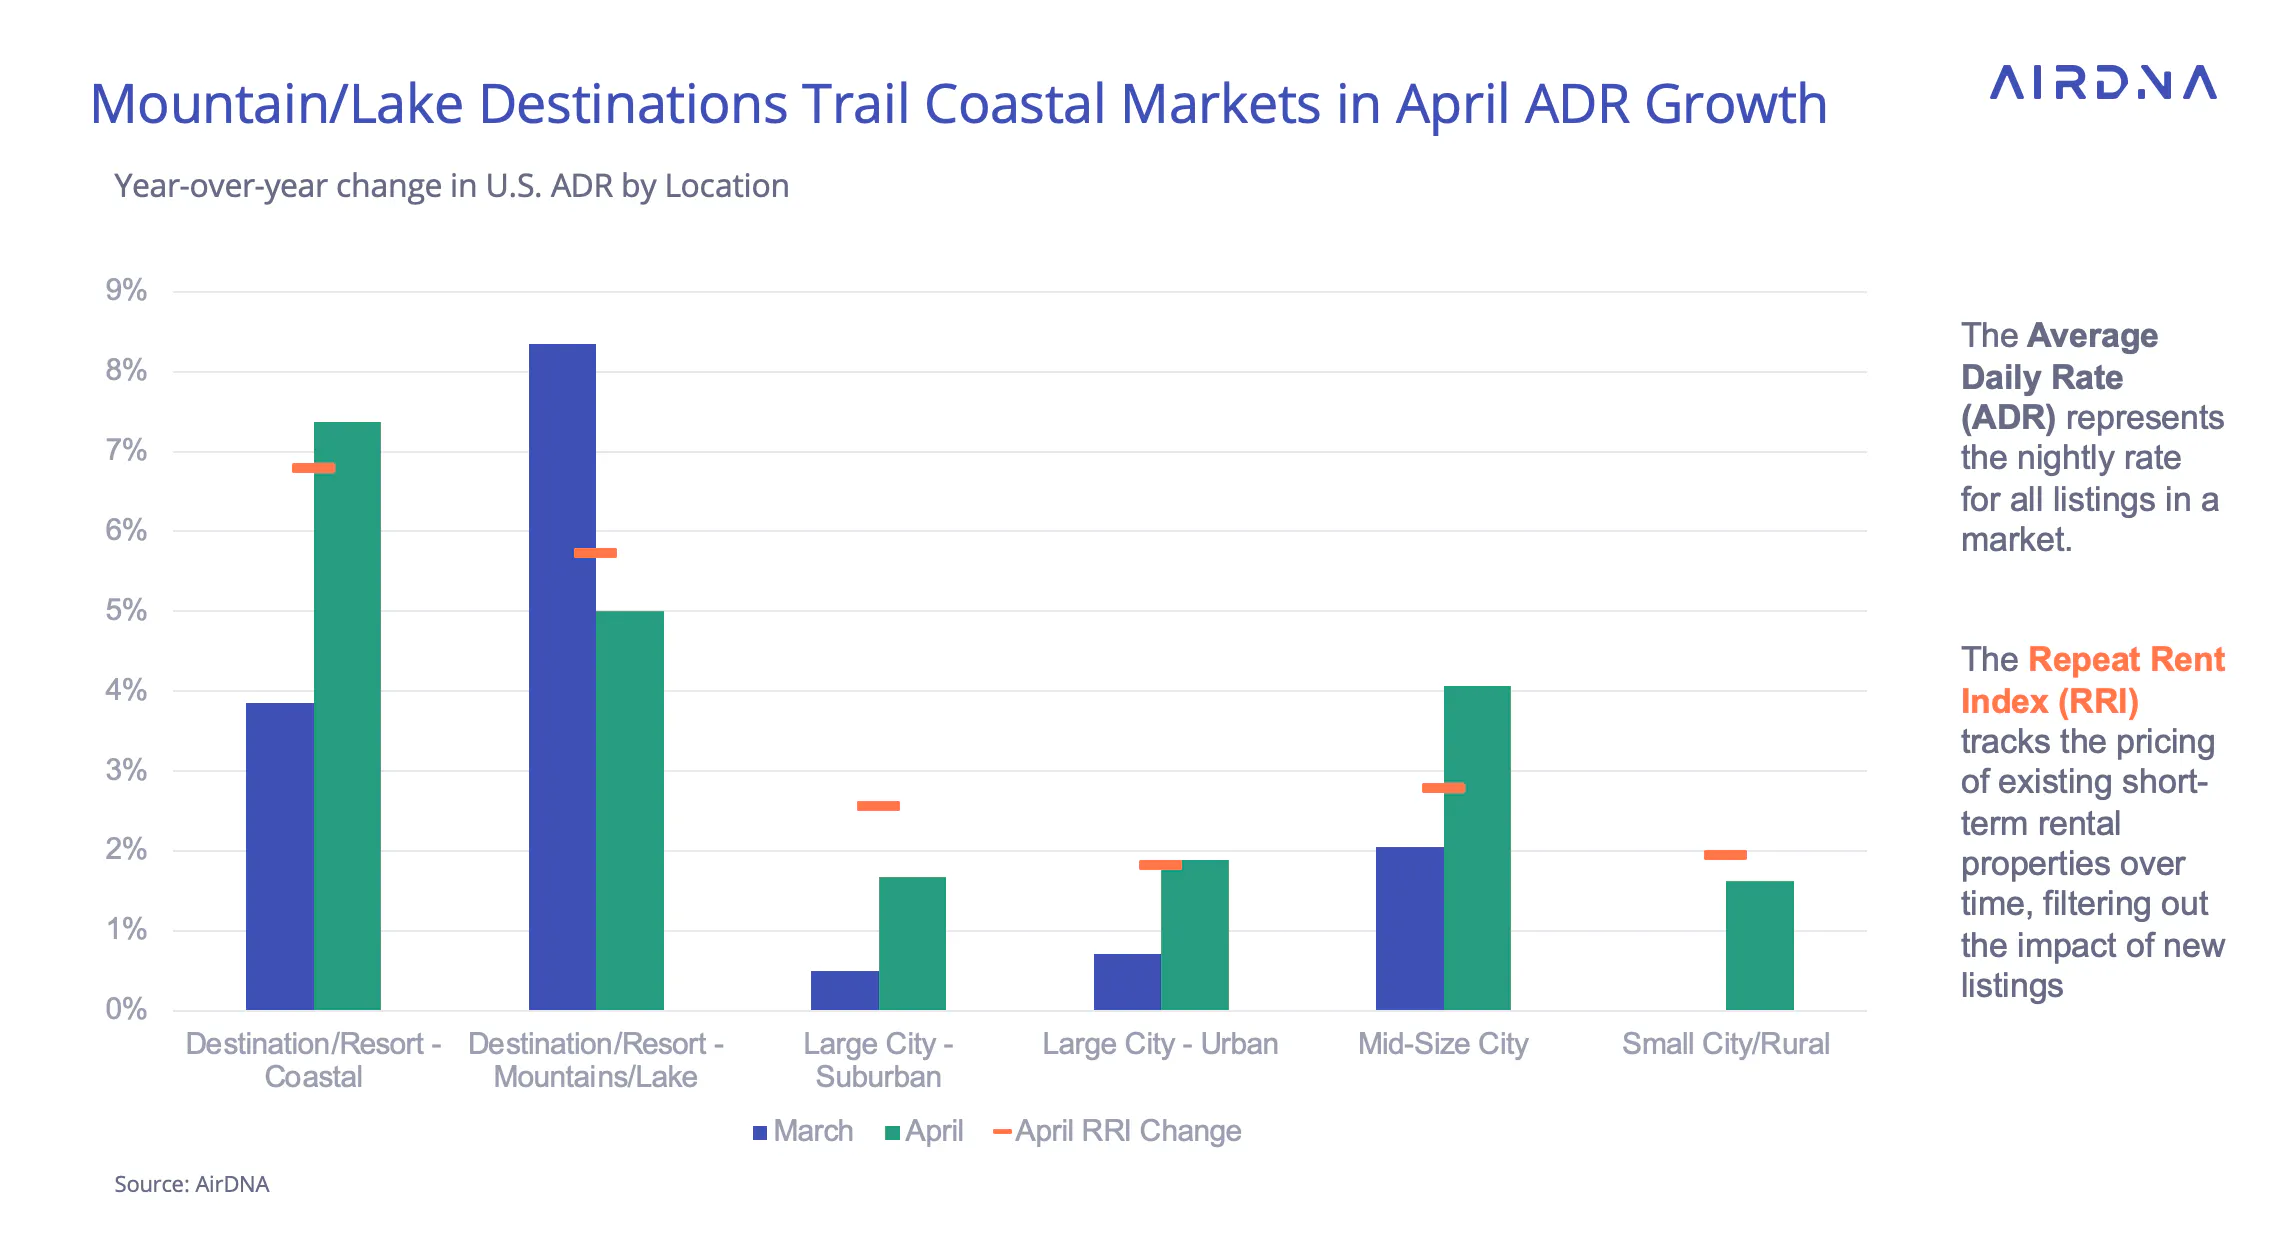
Average daily rate (ADR) growth picked up in April, rising 5.1% year-over-year—up from 3.1% in March. After a zig-zag pattern through much of 2024, ADR growth appears to have leveled off around the 5% mark, with small fluctuations month to month.
The Repeat Rent Index (RRI), which reflects pricing changes for the same properties year-over-year, followed a similar path. RRI rose to 4.8% in April, up from 3.6% in March. While much of 2024 saw ADR increases outpacing RRI—suggesting pricing shifts were driven by a changing mix of listings—2025 has shown a closer relationship between the two. That tighter alignment points to a more balanced market, where price growth reflects not only mix-shift but also steady demand for existing inventory and constrained supply growth.
By location type, coastal resorts once again led price gains. After a 3.9% rise in March, coastal ADR jumped to 7.4% in April—mirroring the seasonal shift from cooler months into peak beach season. Mountain and lake resorts, which saw an 8.3% increase in March, eased to 5.0% in April, reflecting the tail end of the winter travel window.
Location Trends
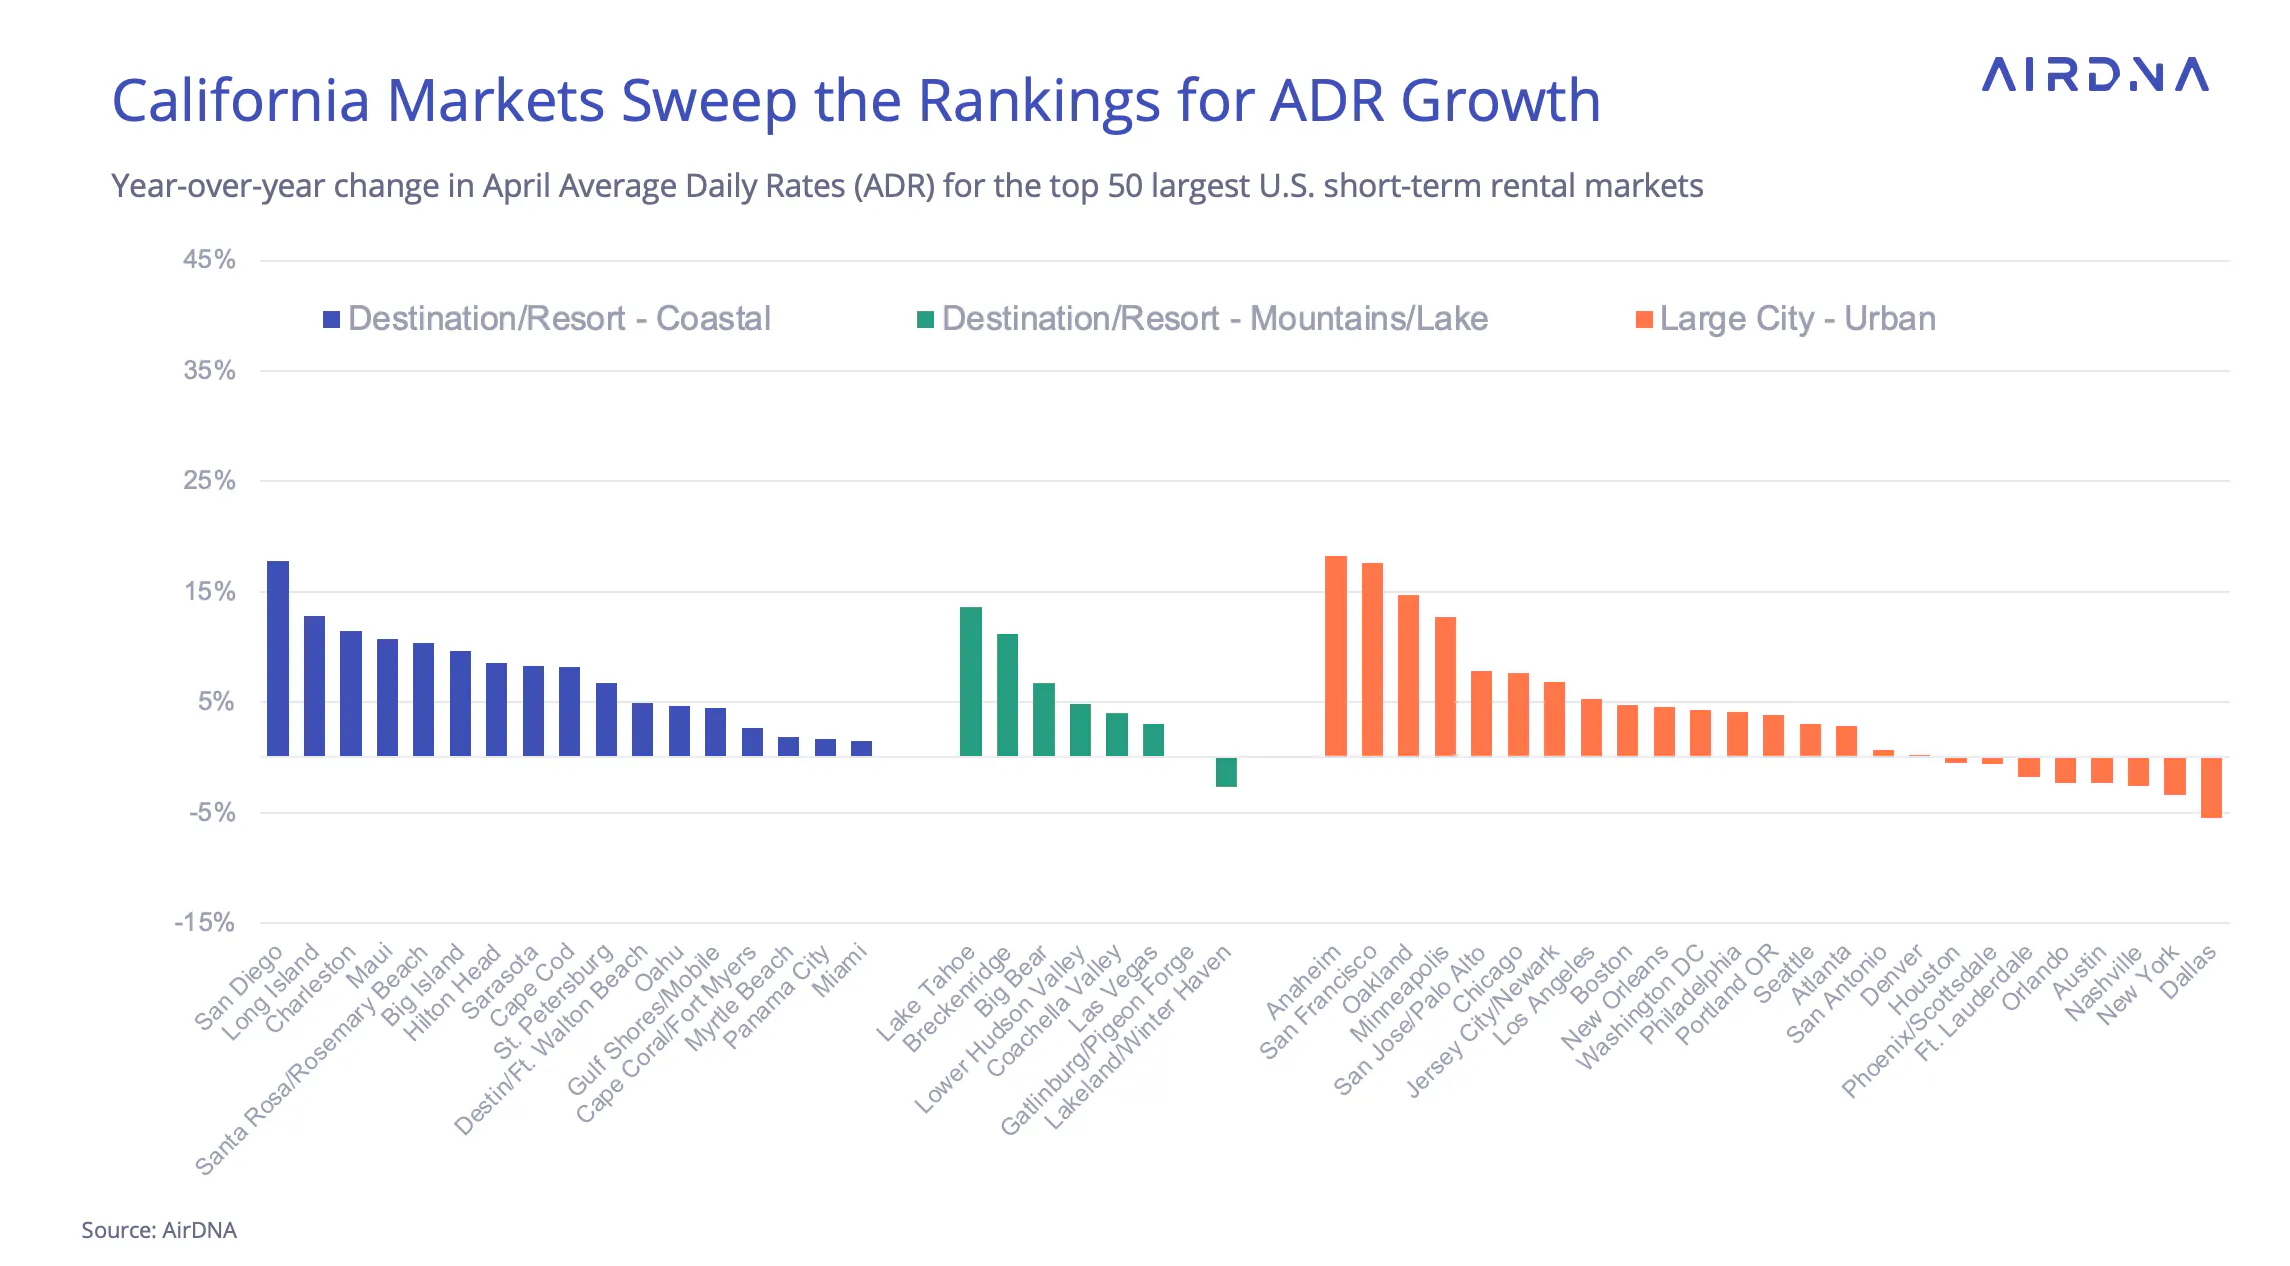
ADR increases were seen broadly within AirDNA’s Top 50 markets (which exclude most mid-size cities and include only a handful of ski destinations), although 9 markets experienced declines. California swept the top markets for ADR growth in the three location types represented in our top 50:
- Anaheim, California (+18.2%, urban)
- San Diego (+17.8%, coastal resort)
- San Francisco (+17.6%, urban)
- Oakland, California (+14.7%, urban)
- Lake Tahoe, California (+13.6%, mountain resort)
- Long Island, New York (+12.8%, coastal resort)
In some of these cities — particularly San Diego and several Bay Area metros — renewed regulatory scrutiny on short-term rentals may be limiting supply, giving existing operators more leverage to raise rates. Long Island (+12.8, coastal resort) had the highest non-California ADR growth rate for April among our top 50 markets.
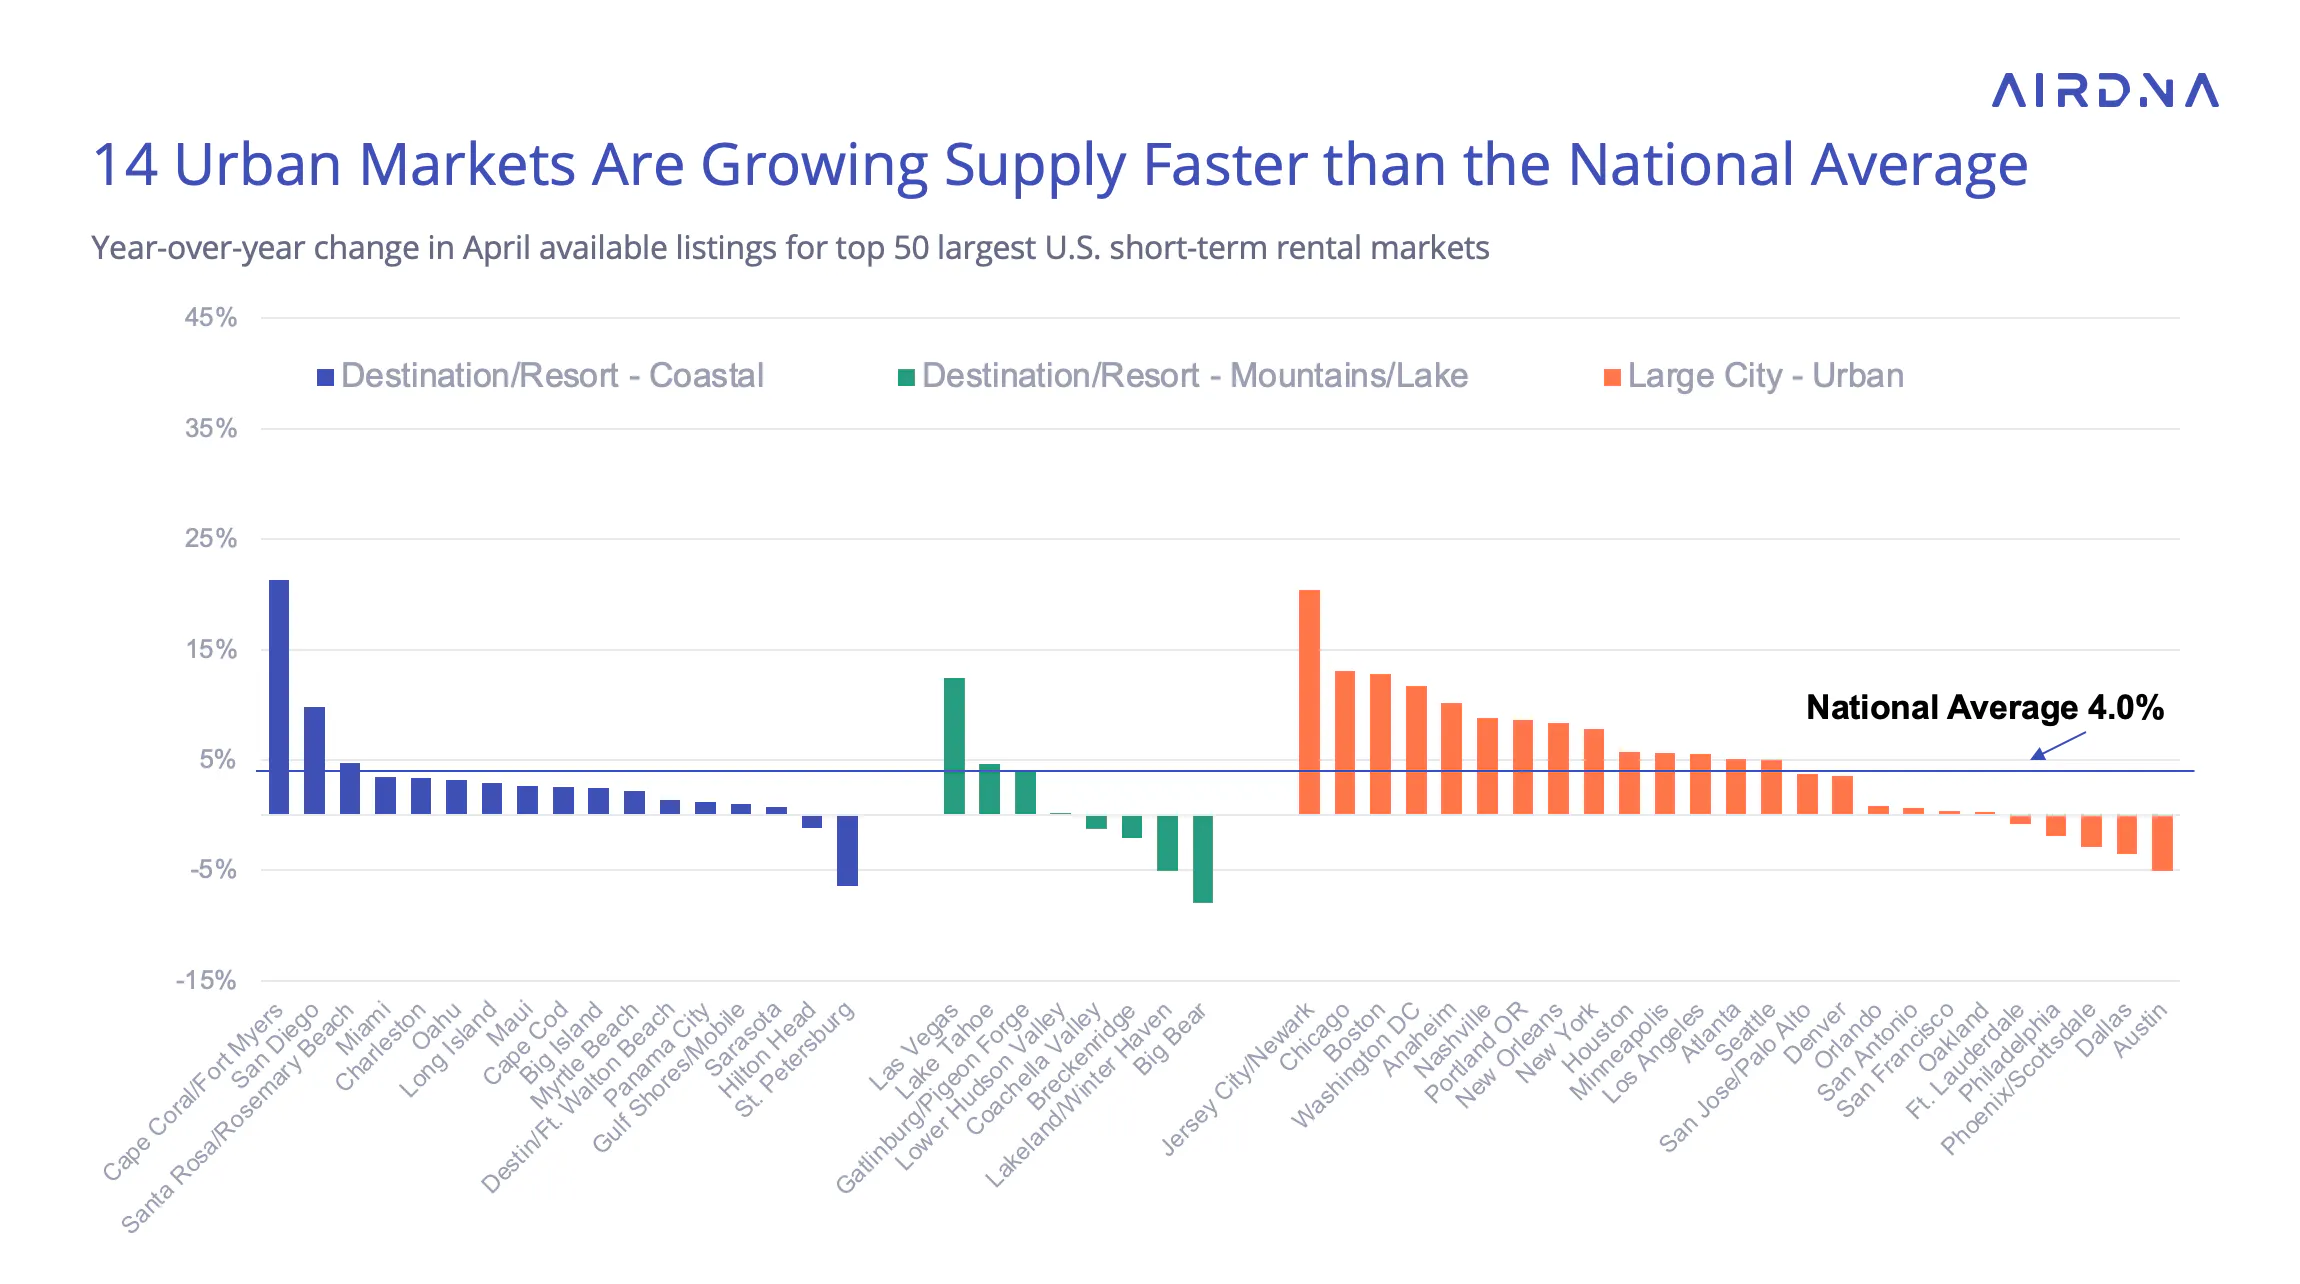
Another developing story from the markets is how urban supply growth is beginning to rebound. Over the past year, urban supply growth has appeared sluggish since a regulatory crackdown in New York sharply reduced listing availability there. Now, that trend appears to be shifting. Of the 19 Top 50 markets growing faster than the national 4.0% supply rate, 14 were urban areas.
Notable urban markets with strong listing growth:
- Jersey City/Newark, New Jersey (+20.4%)
- Chicago (+13.2%)
- Boston (+12.8%)
- Washington, D.C. (+11.7%)
Outside the major metros, Cape Coral/Fort Myers, Florida stood out with +21.3% listing growth as it continues to recover and expand beyond its pre-Hurricane Ian inventory.
Pacing Data
Despite rising economic uncertainty—particularly following recent trade policy announcements—future demand has held up well so far. Each month is pacing between 8-10% higher than in the previous year. Listing growth between 4–5% suggests occupancy should be tracking positively. However, the number of available listing nights is pacing slightly ahead of demand, leading to a small decline in forward-looking occupancy.
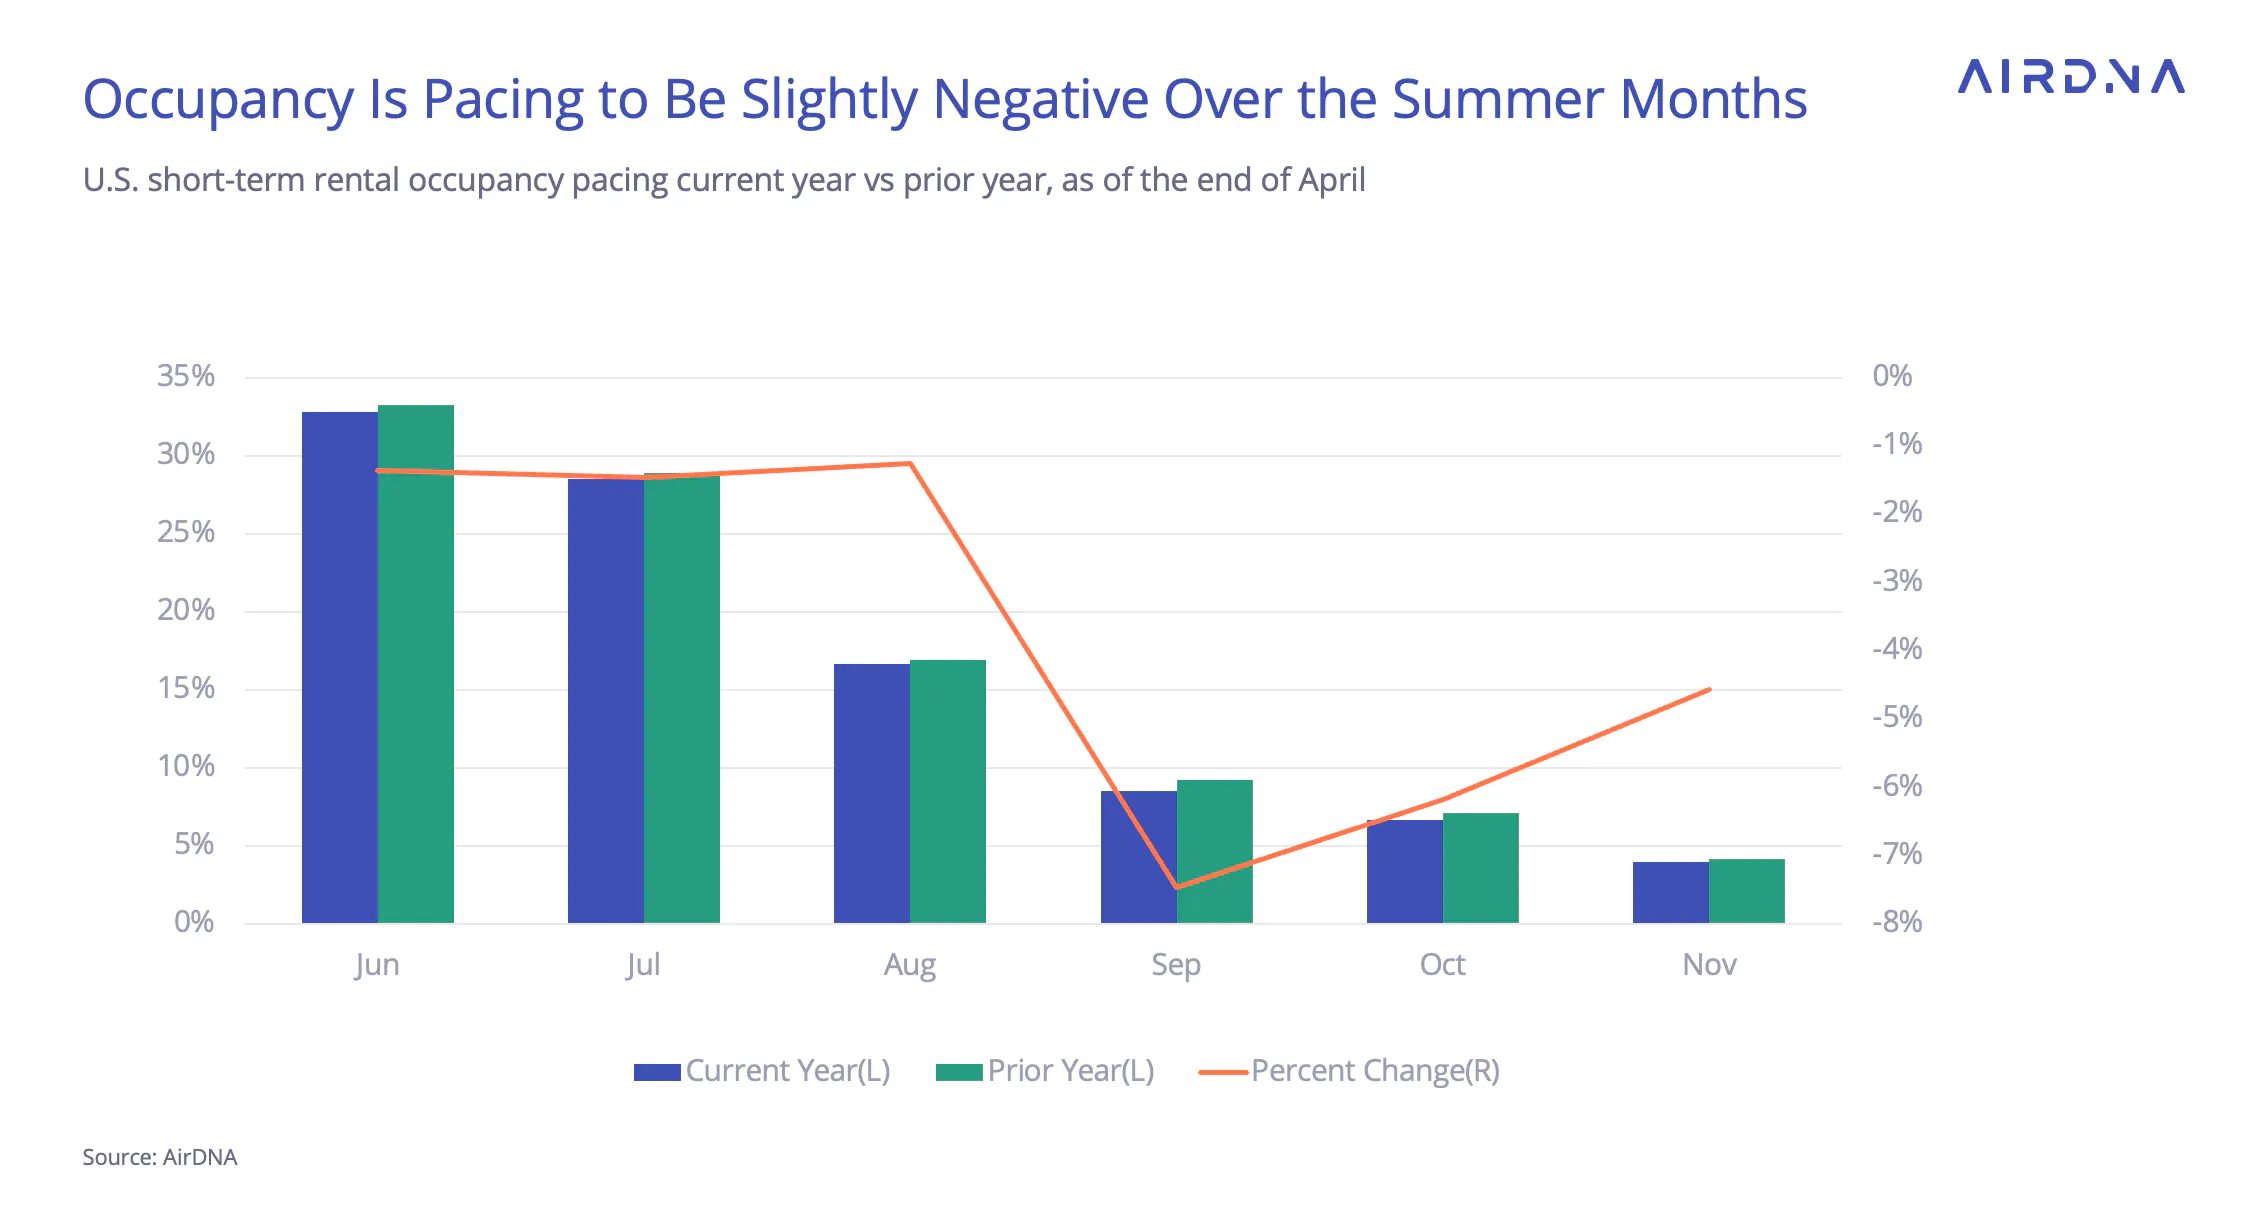
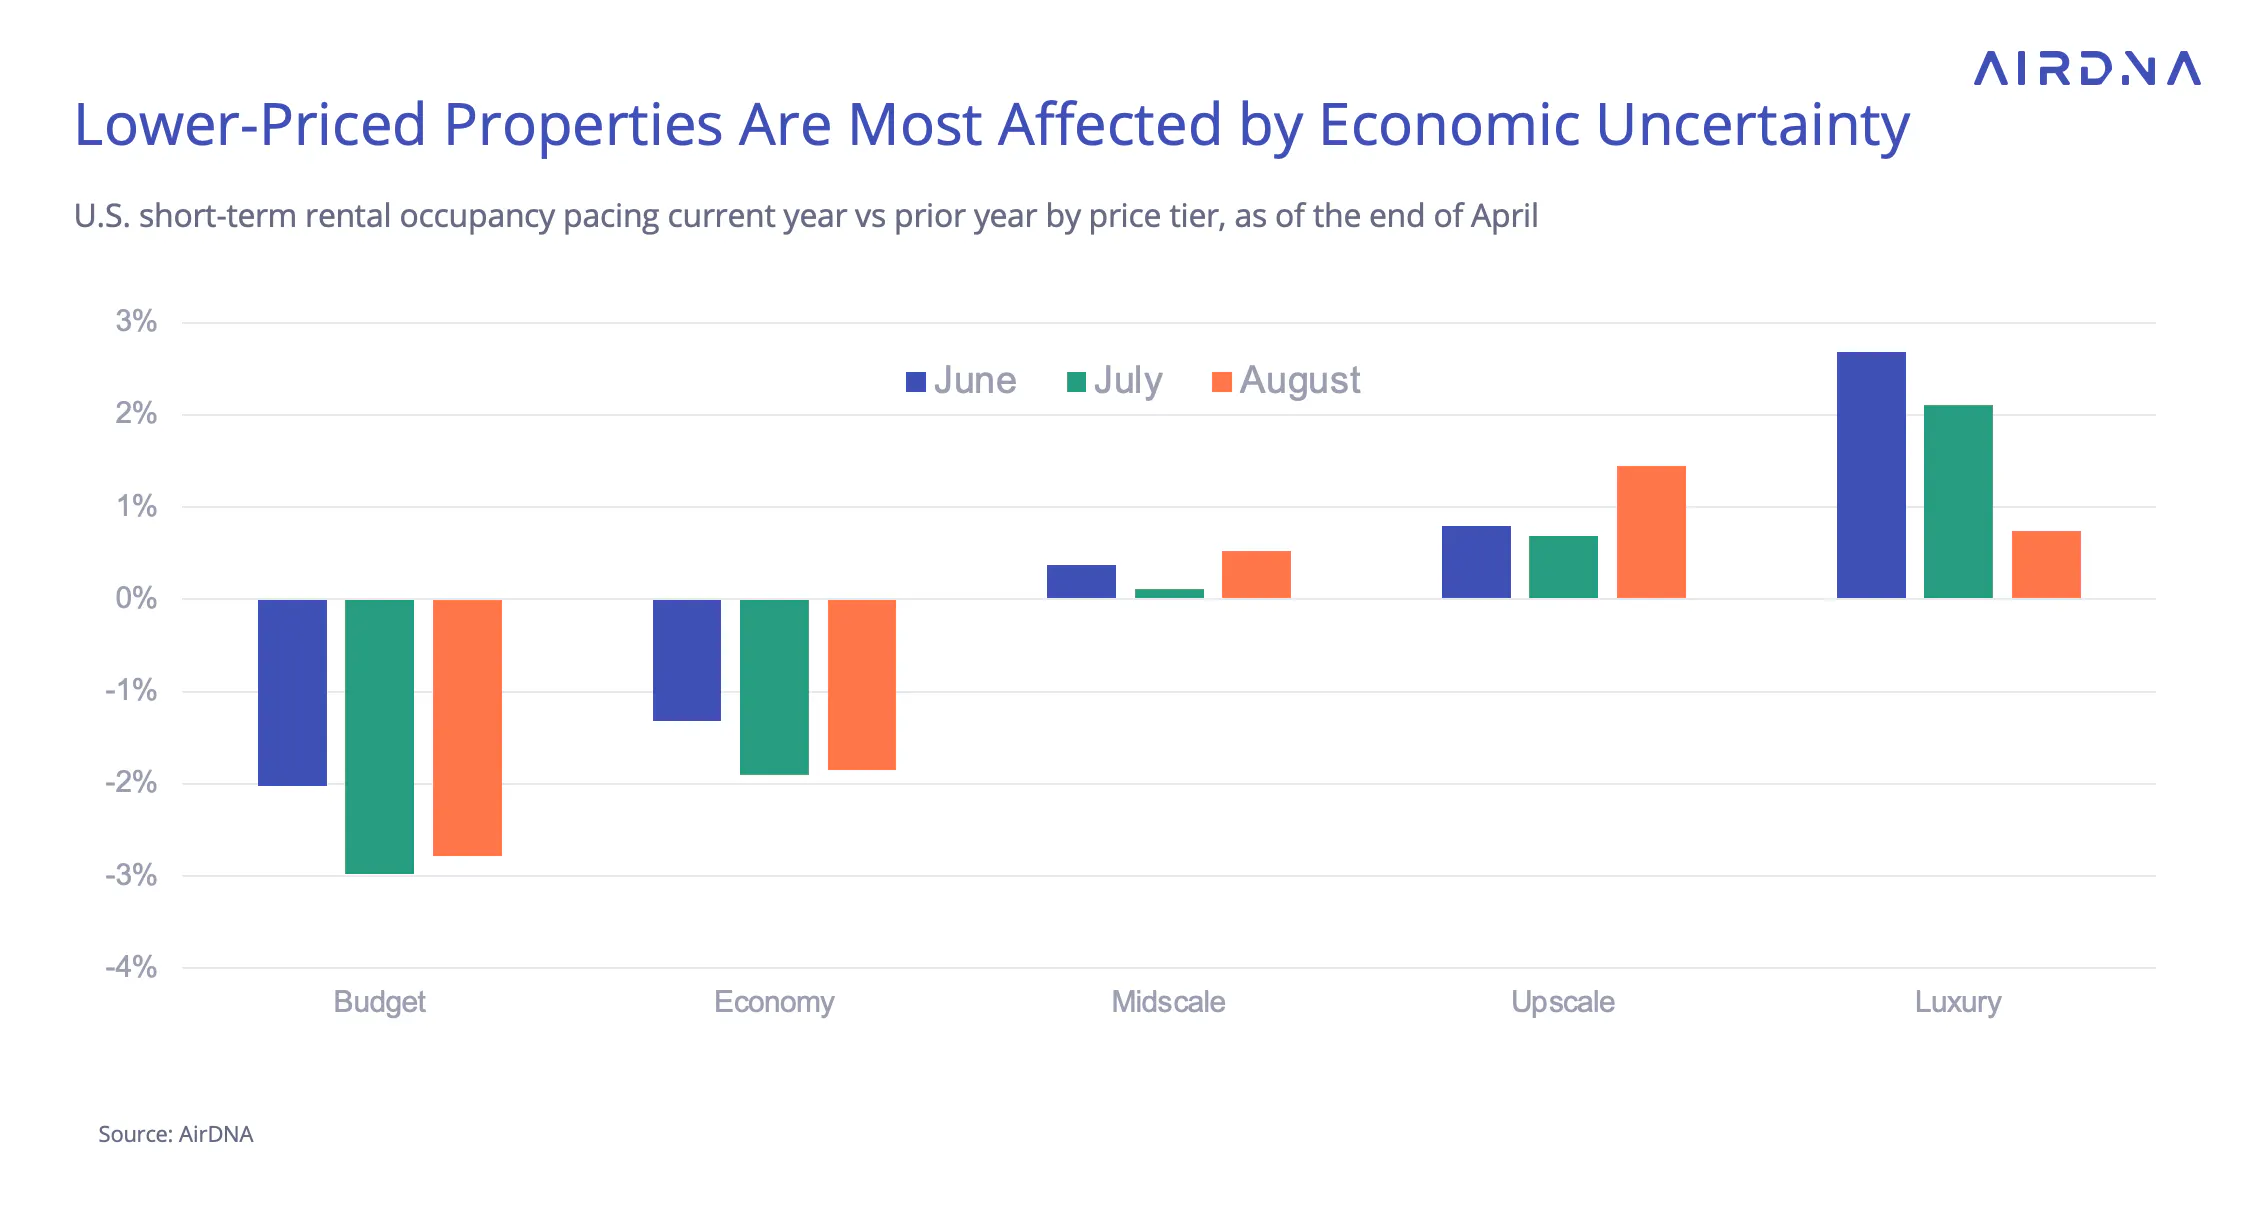
These declines aren’t uniform. Two key patterns are emerging: by price tier and by location type.
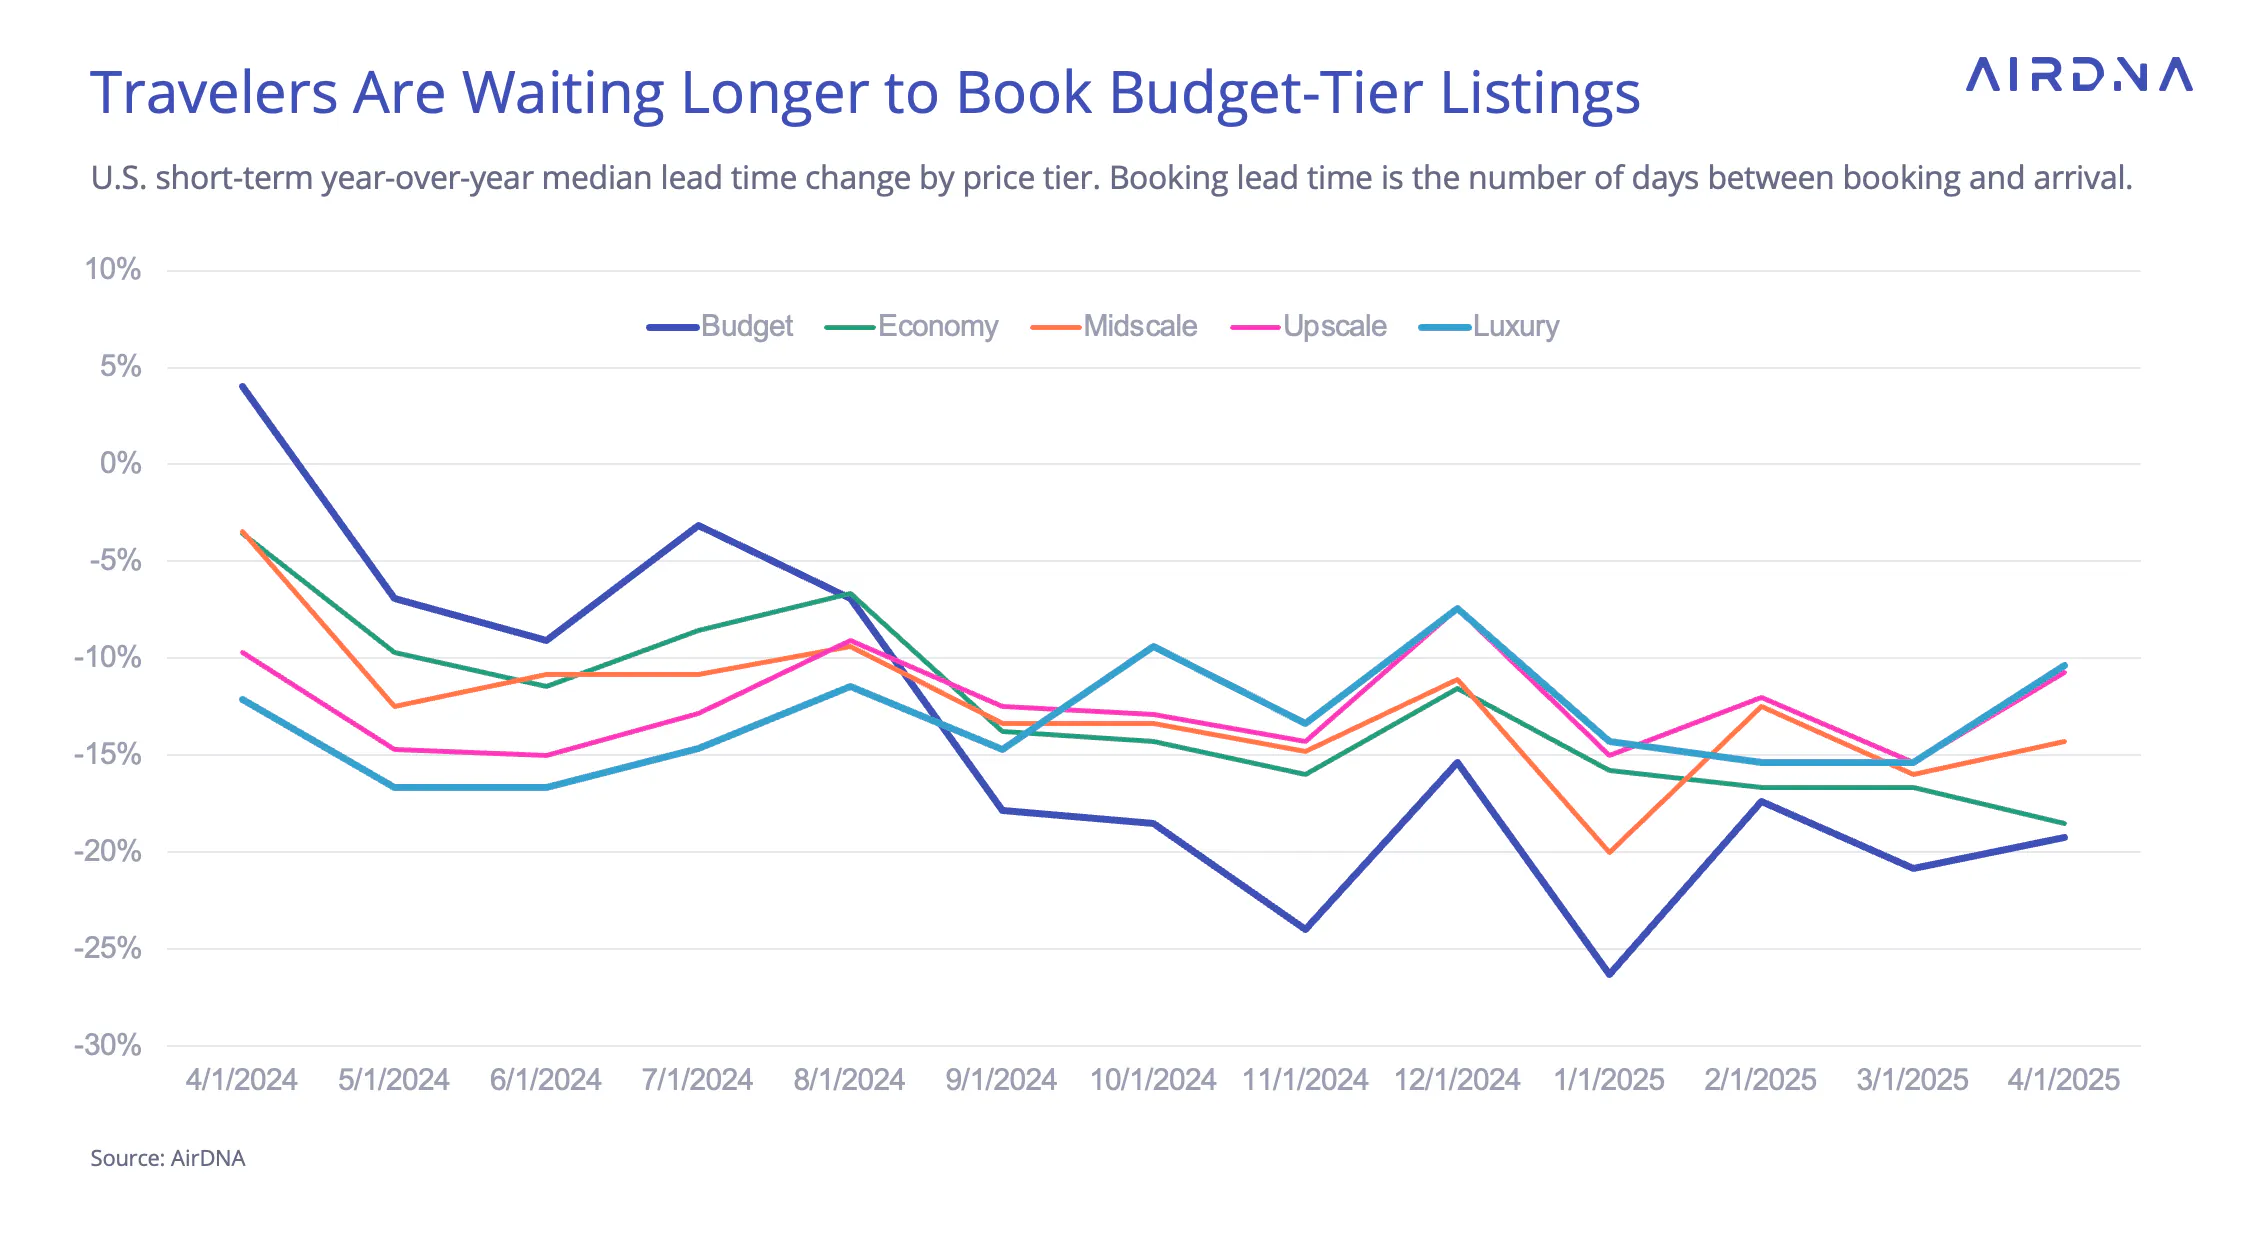
Lower-priced properties are seeing the sharpest drop in occupancy pacing. This could reflect cautious behavior among budget-focused travelers, either delaying bookings or opting out of summer travel altogether while waiting for economic conditions to stabilize.
Booking lead times show a similar trend. Since September 2024, median lead times for budget listings have steadily declined. In April, lead times in the economy tier fell further, suggesting more last-minute behavior in the lower price segments. Across all tiers, lead times have been trending downward since May 2024.
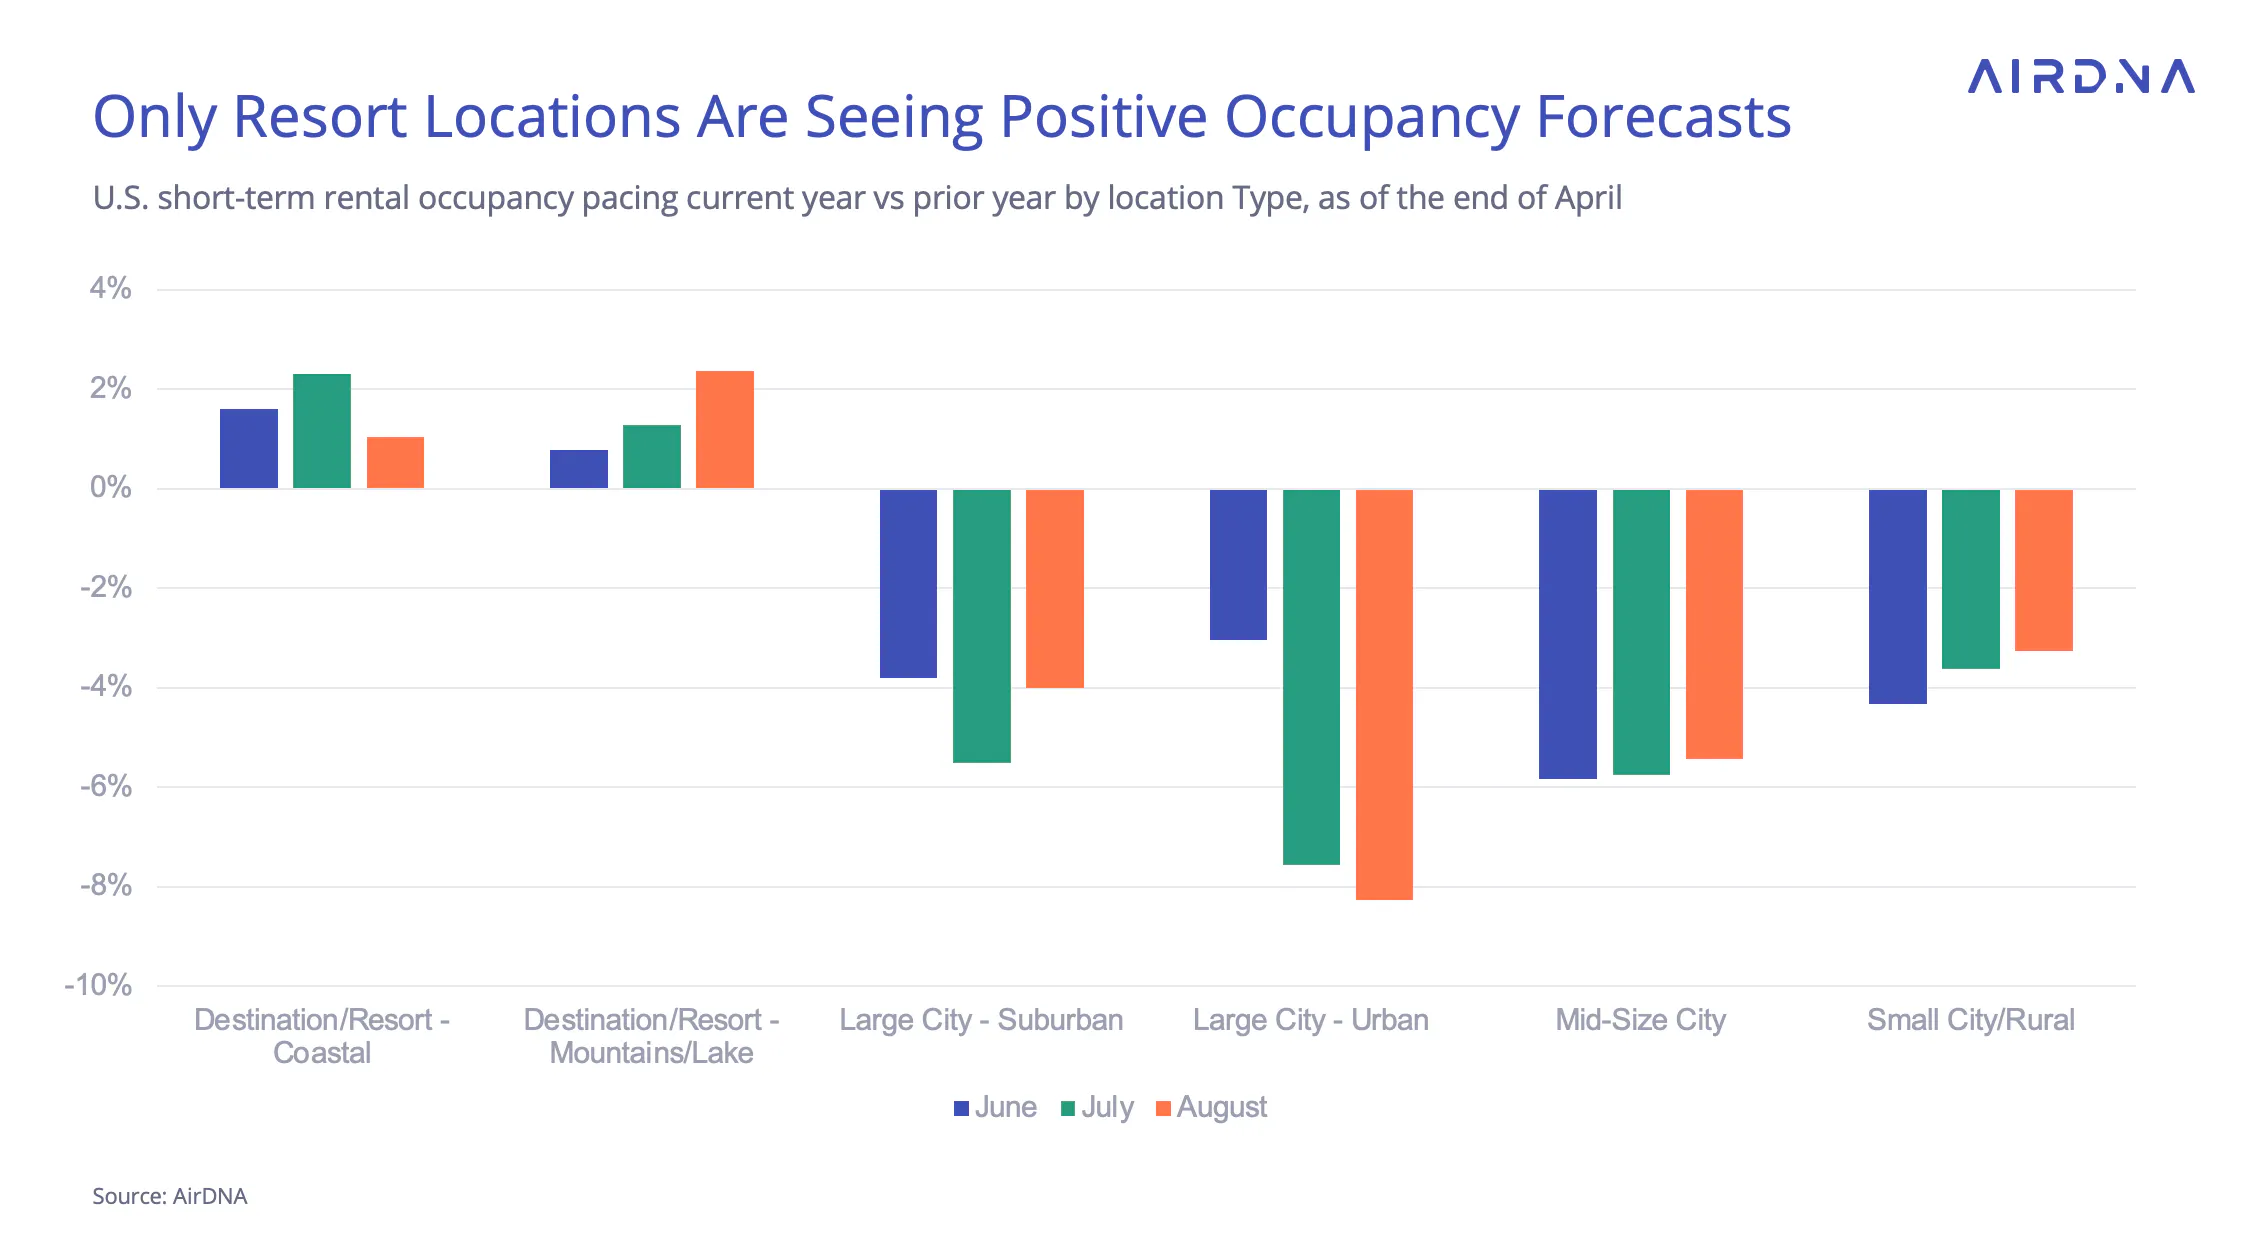
Location also plays a clear role. Resort destinations—especially those favored by domestic travelers—are showing positive pacing. In contrast, major urban centers, which rely more heavily on international travel, are seeing more pronounced declines.
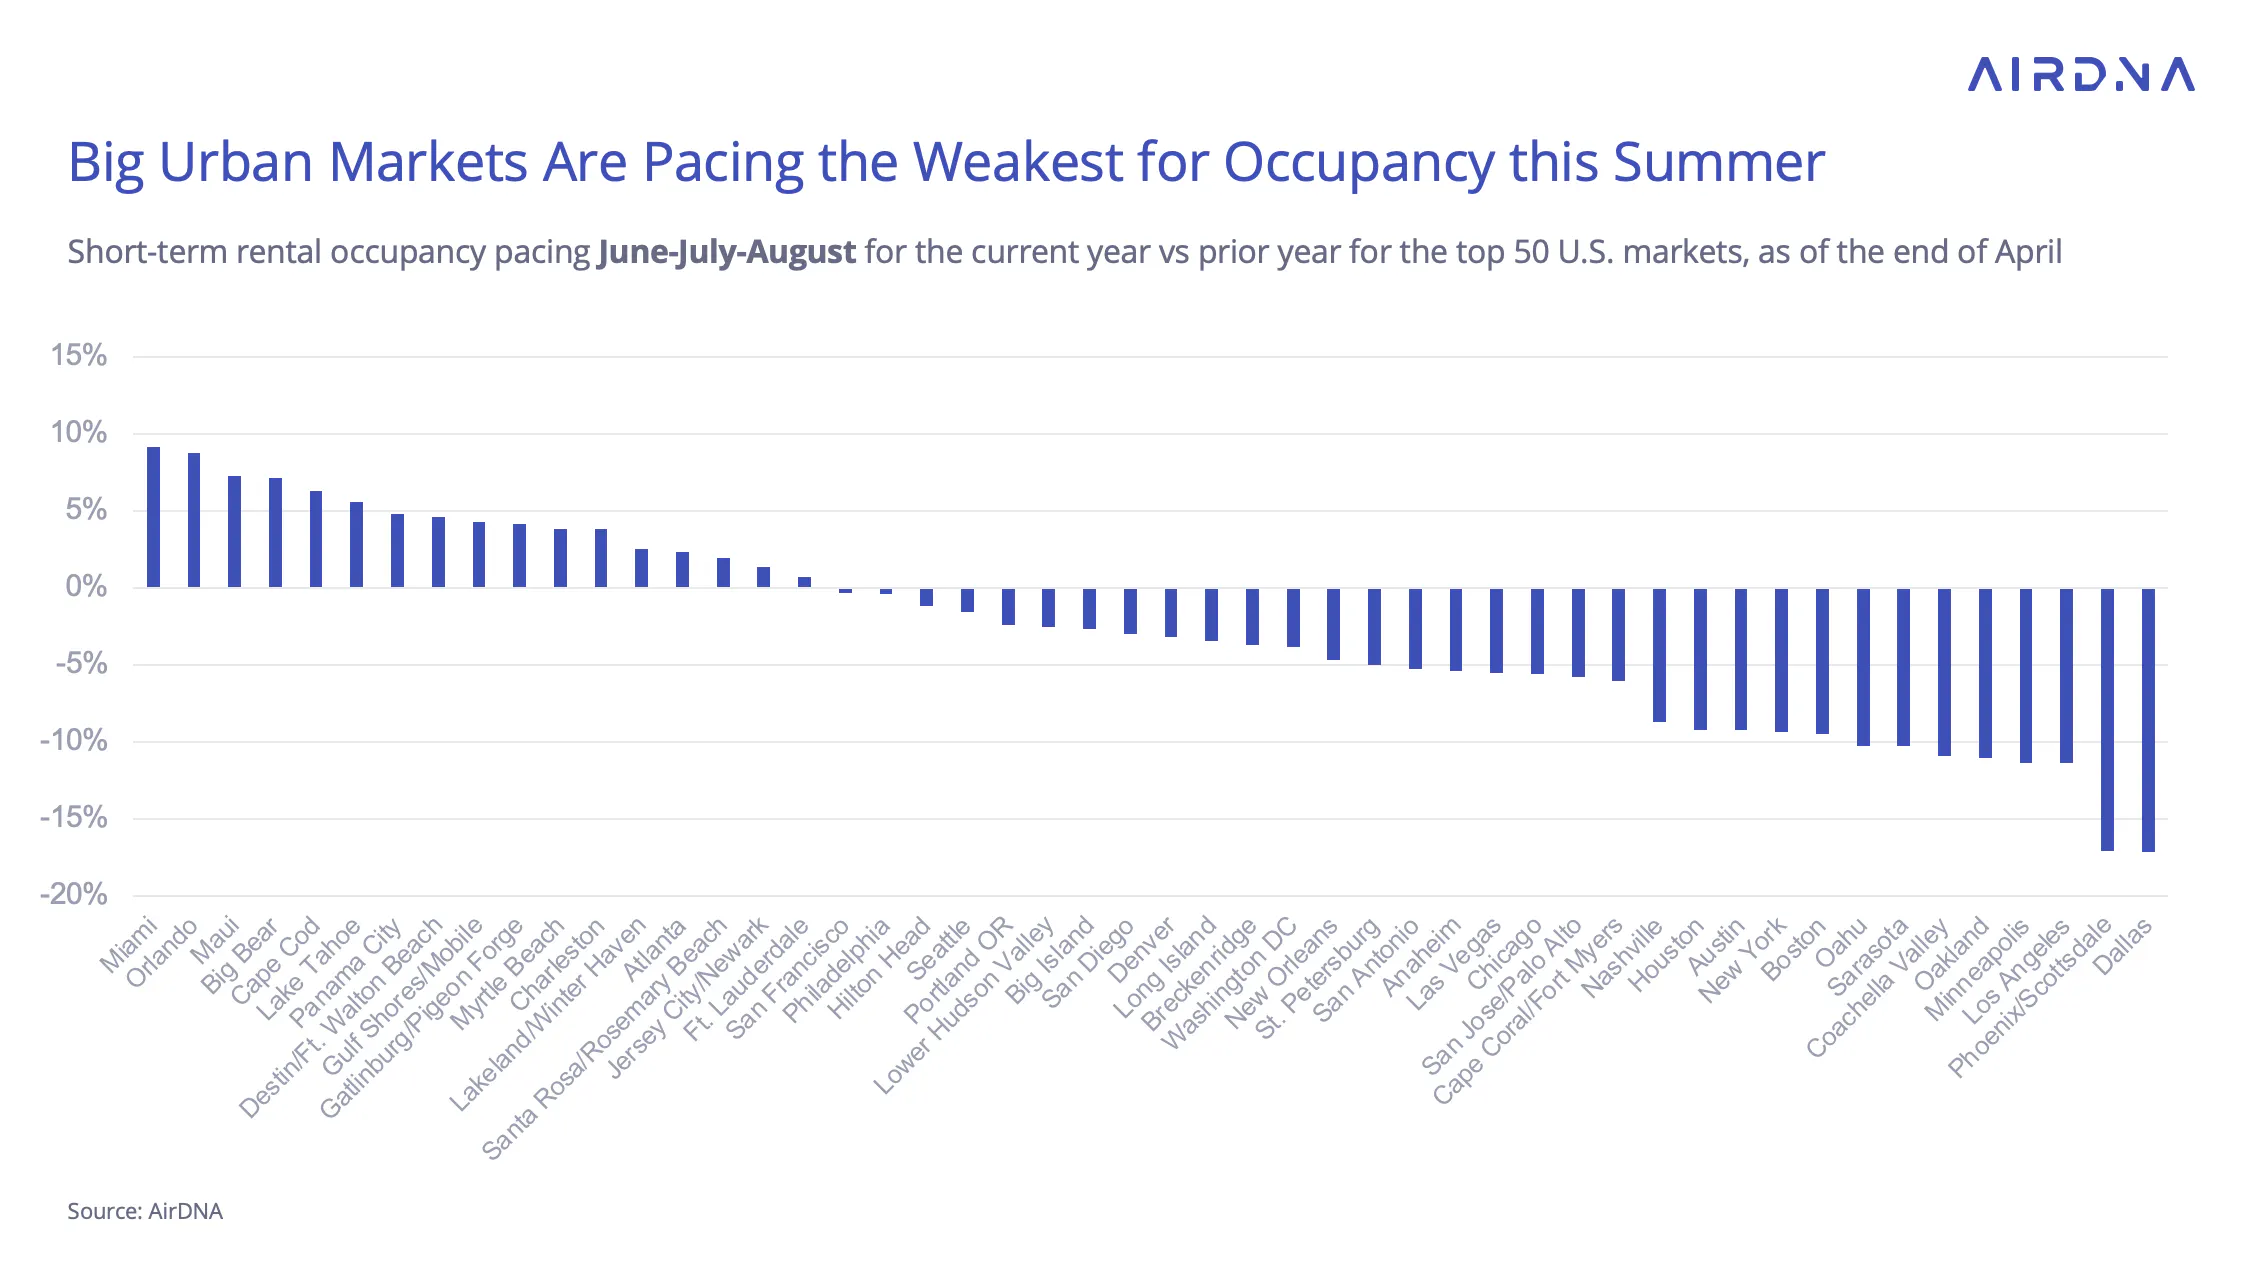
This pattern is reinforced when looking at individual Top 50 markets for June through August. Resort locations dominate the top tier for occupancy pacing, while large cities make up the bulk of the underperforming group. Rapid supply growth in these urban areas may be outpacing demand, especially if international travel softens or economic sentiment weakens.
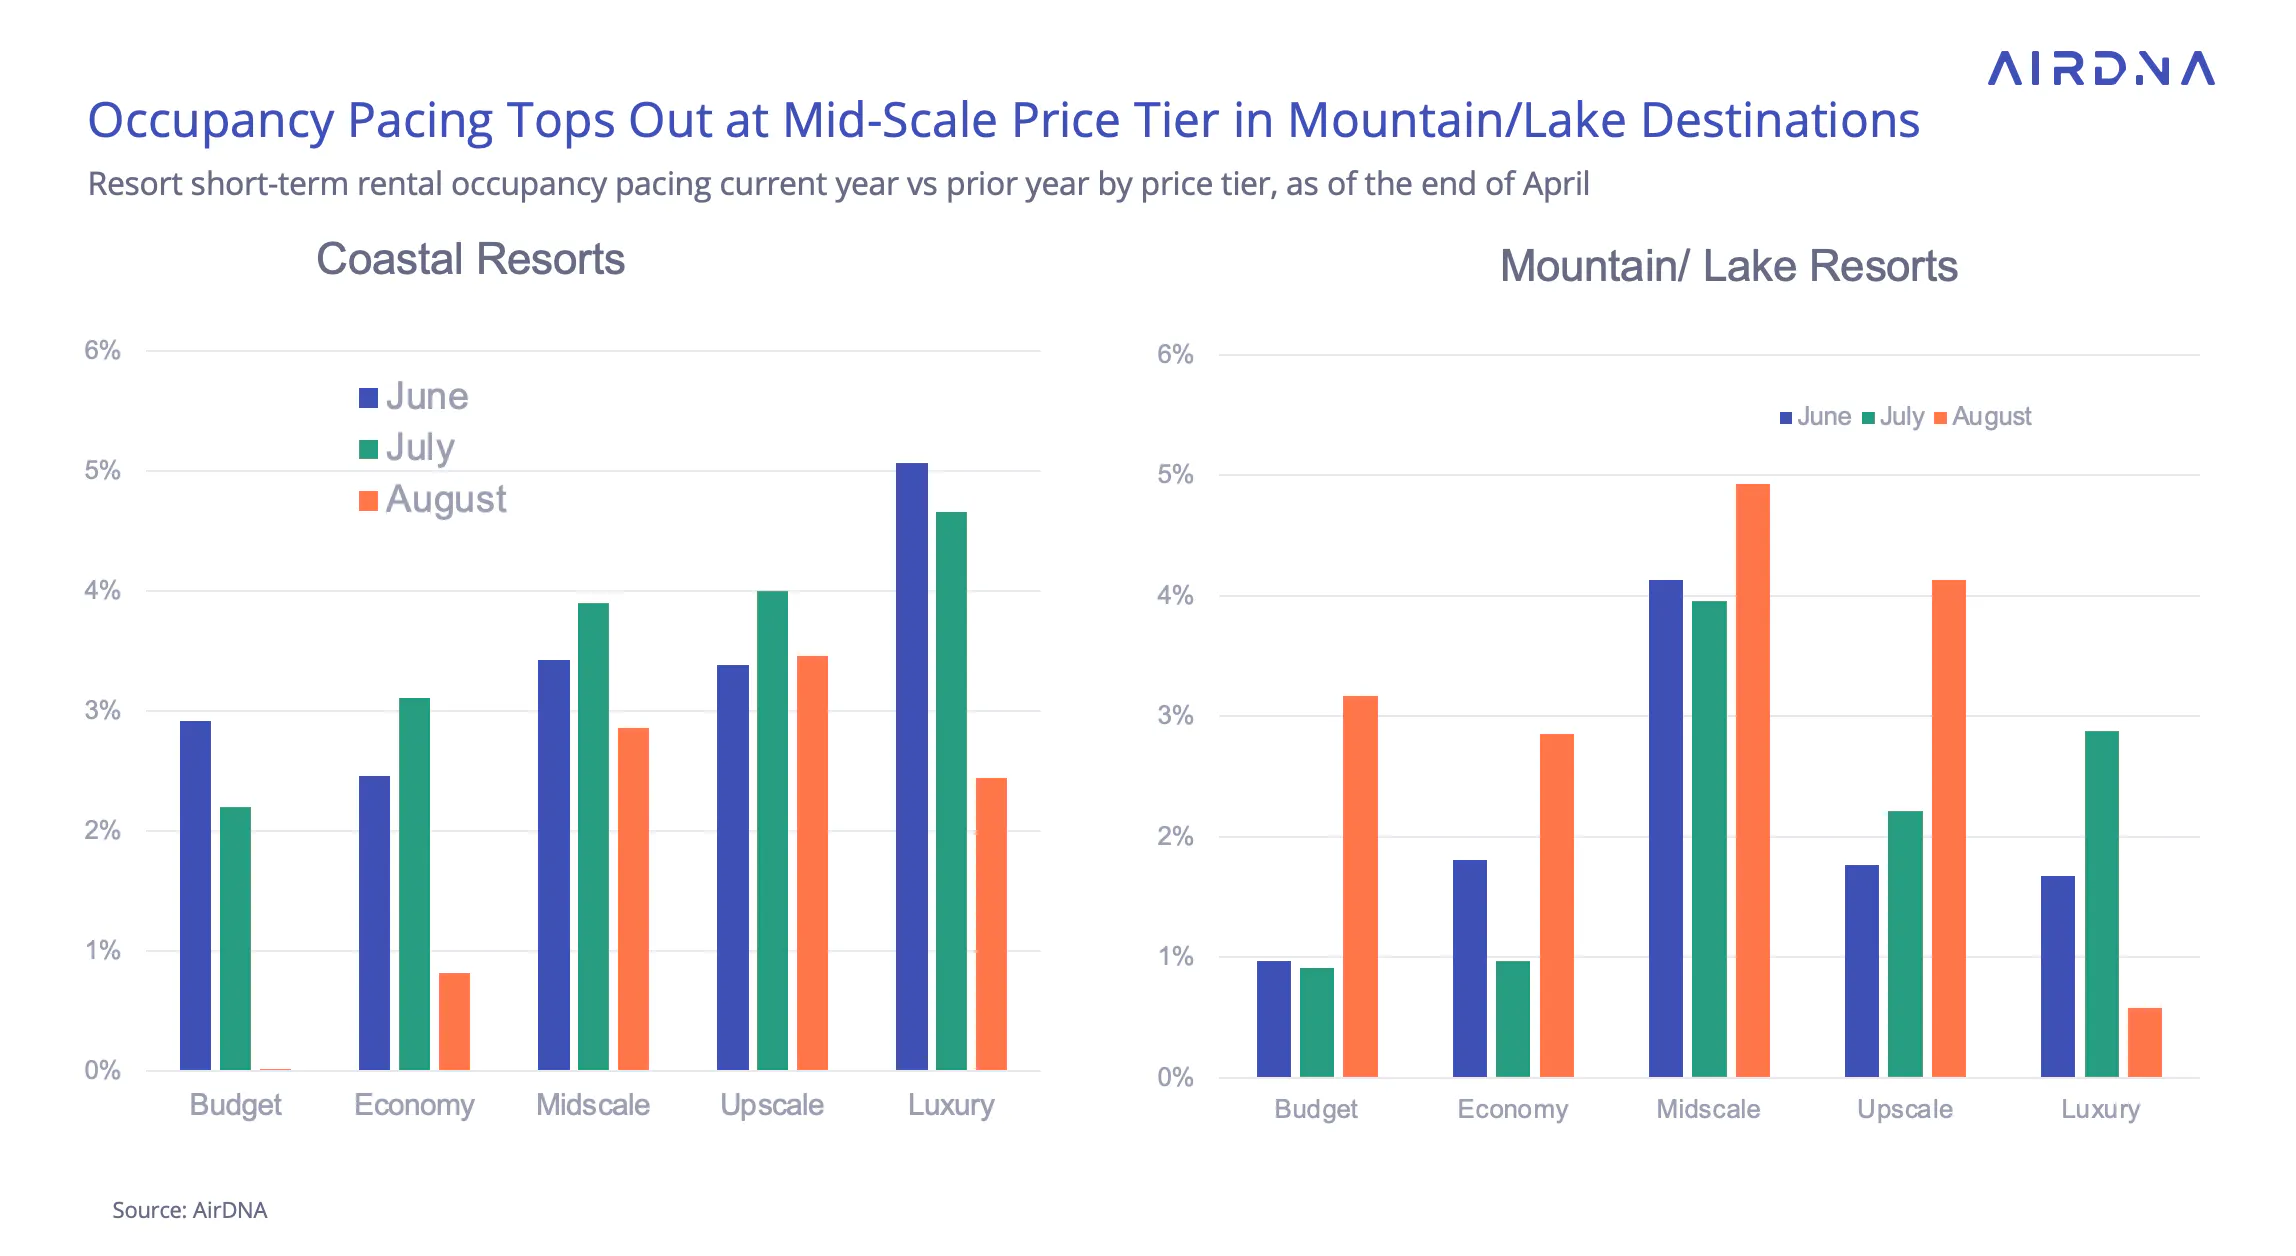
Interestingly, even within resort markets, pricing still matters. In mountain and lake destinations—the most expensive on average—occupancy pacing appears to peak at the midscale tier, suggesting limits to what travelers are willing to spend in those segments.
This trend is repeated when looking at individual Top 50 markets for June through August. Resort locations dominate the top tier for occupancy pacing, while large metros make up the bulk of the underperforming group. The high supply growth in urban areas may see some difficulty being absorbed with the combination of an economic downturn and reduced international travel.
For locations, resort destinations, which tend to attract domestic leisure travelers, are showing positive occupancy pacing. In contrast, urban areas—especially the downtown cores of large cities that rely more heavily on international visitors—are seeing notable declines.
ARTICLE SUMMARY
April 2025 saw strong short-term rental performance, with demand up 10.1% and RevPAR rising 12.7%. Spring Break timing boosted occupancy, despite persistent economic uncertainty.
Bram Gallagher
AirDNA Director of Economics and Forecasting
Bram Gallagher is an Economist at AirDNA, specializing in uncovering insights that drive smarter short-term rental decisions. He put his Ph.D. in Economics from the University of Georgia to work researching and forecasting hotel data with CBRE prior to joining AirDNA, as well as teaching economics at a number of universities. In his spare time, Bram enjoys making wooden furniture with hand tools.