Airbnb’s Listing Highlights: What They Say, and Why They Matter
Published: October 16, 2026
Last updated: October 22, 2026

Jamie Lane
Scroll past the photos on almost any Airbnb listing and, before the description, you’ll find up to three short lines with an icon next to each: “Self check-in”, “Peace and quiet”, “Top 5% of homes”. Airbnb calls these highlights. Hosts don’t write them. Airbnb picks them from what it knows about the home, its reviews and the listings around it, and they are some of the first words a guest reads.
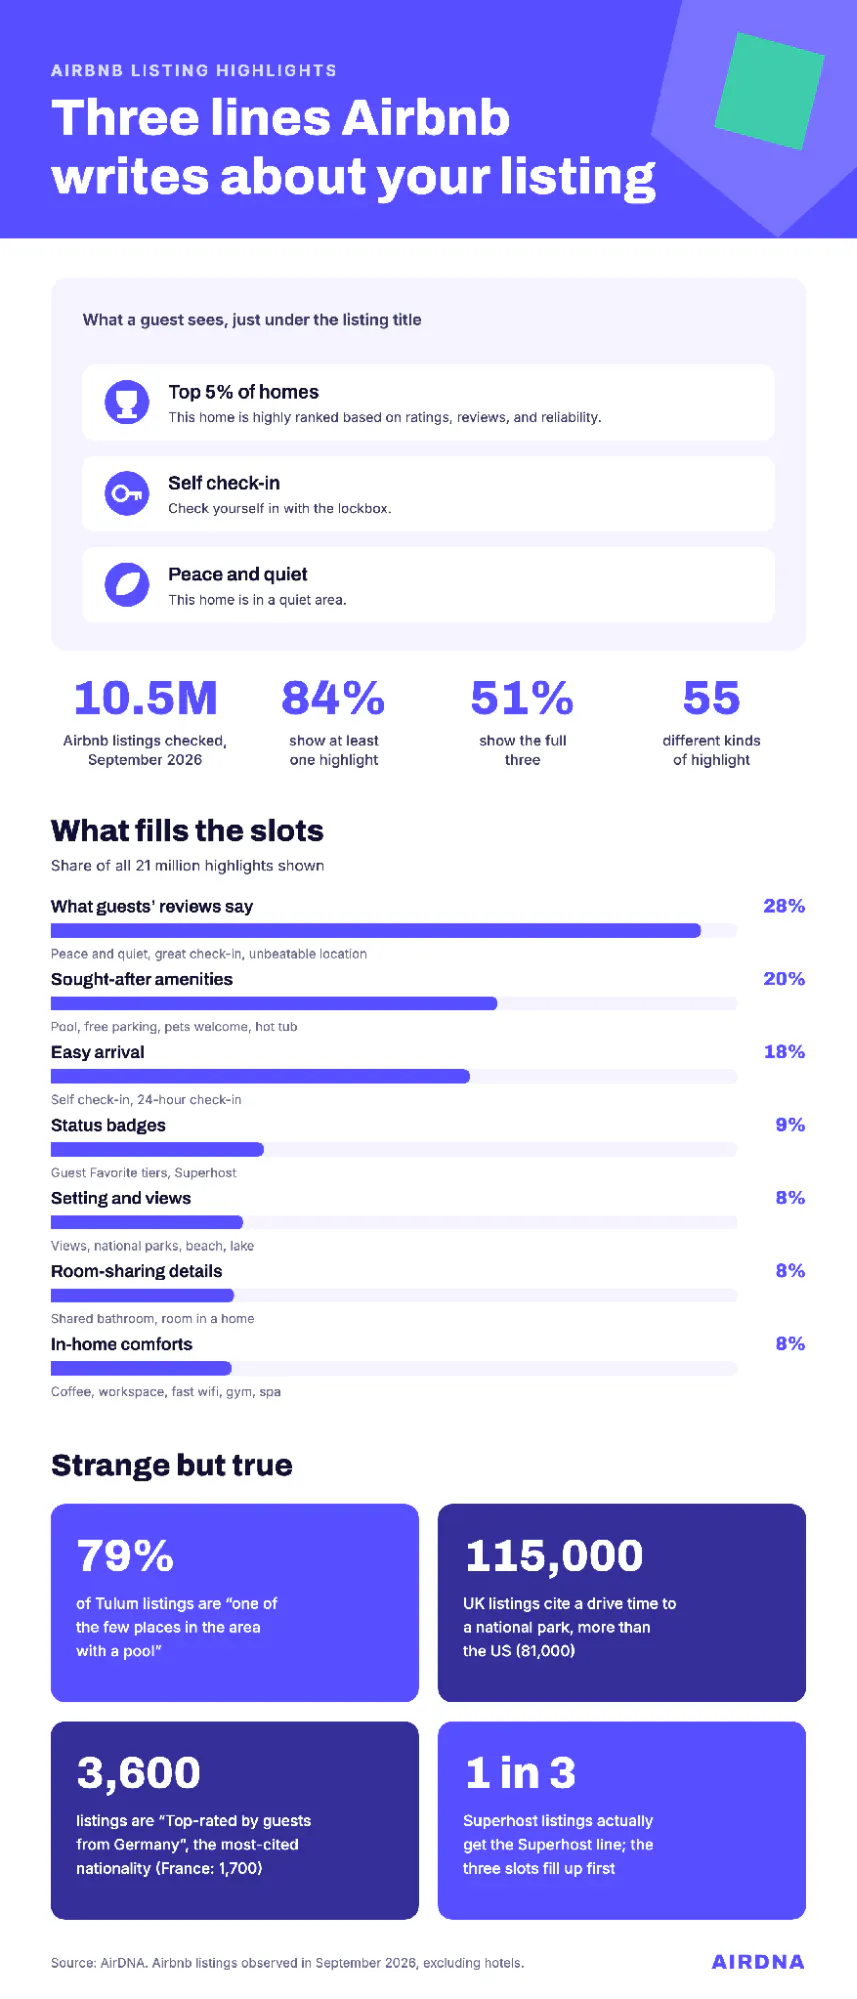
I pulled the highlights for about 10.5 million Airbnb listings we observed in September 2026. About 84% showed at least one, and about half showed the full three. Across all of them I counted 55 different kinds of highlight, from “Park for free” to the drive time to the nearest national park.
Key Takeaways
- About 84% of the 10.5 million Airbnb listings AirDNA observed in September 2026 showed at least one highlight, and about half showed three.
- Self check-in is the most common highlight, on about 36% of listings, while lines drawn from guest reviews make up about 28% of all highlights.
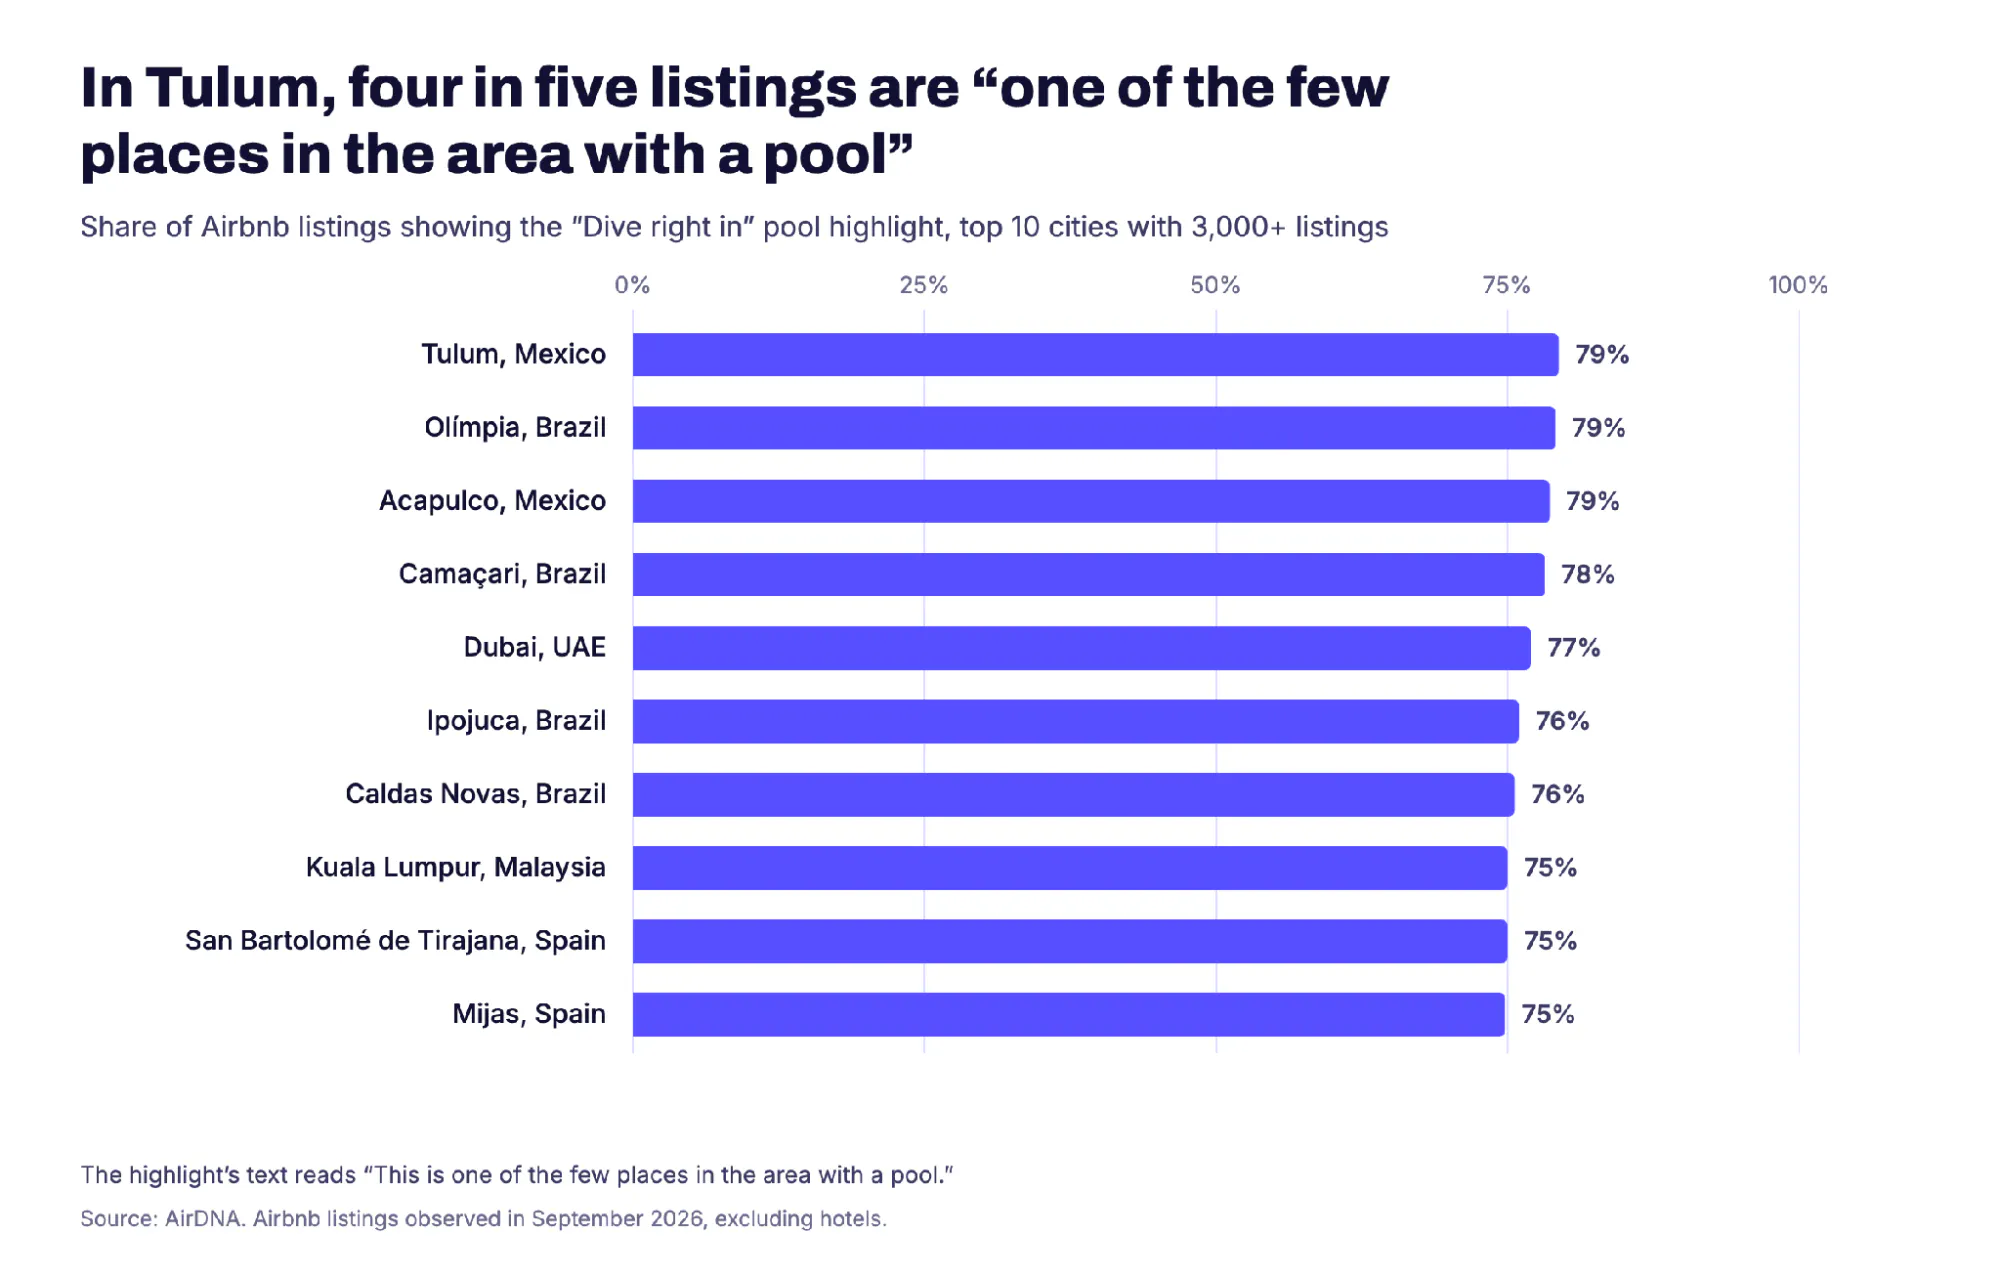
- The pool line, “one of the few places in the area with a pool”, appears on about four in five listings in Tulum, Mexico.
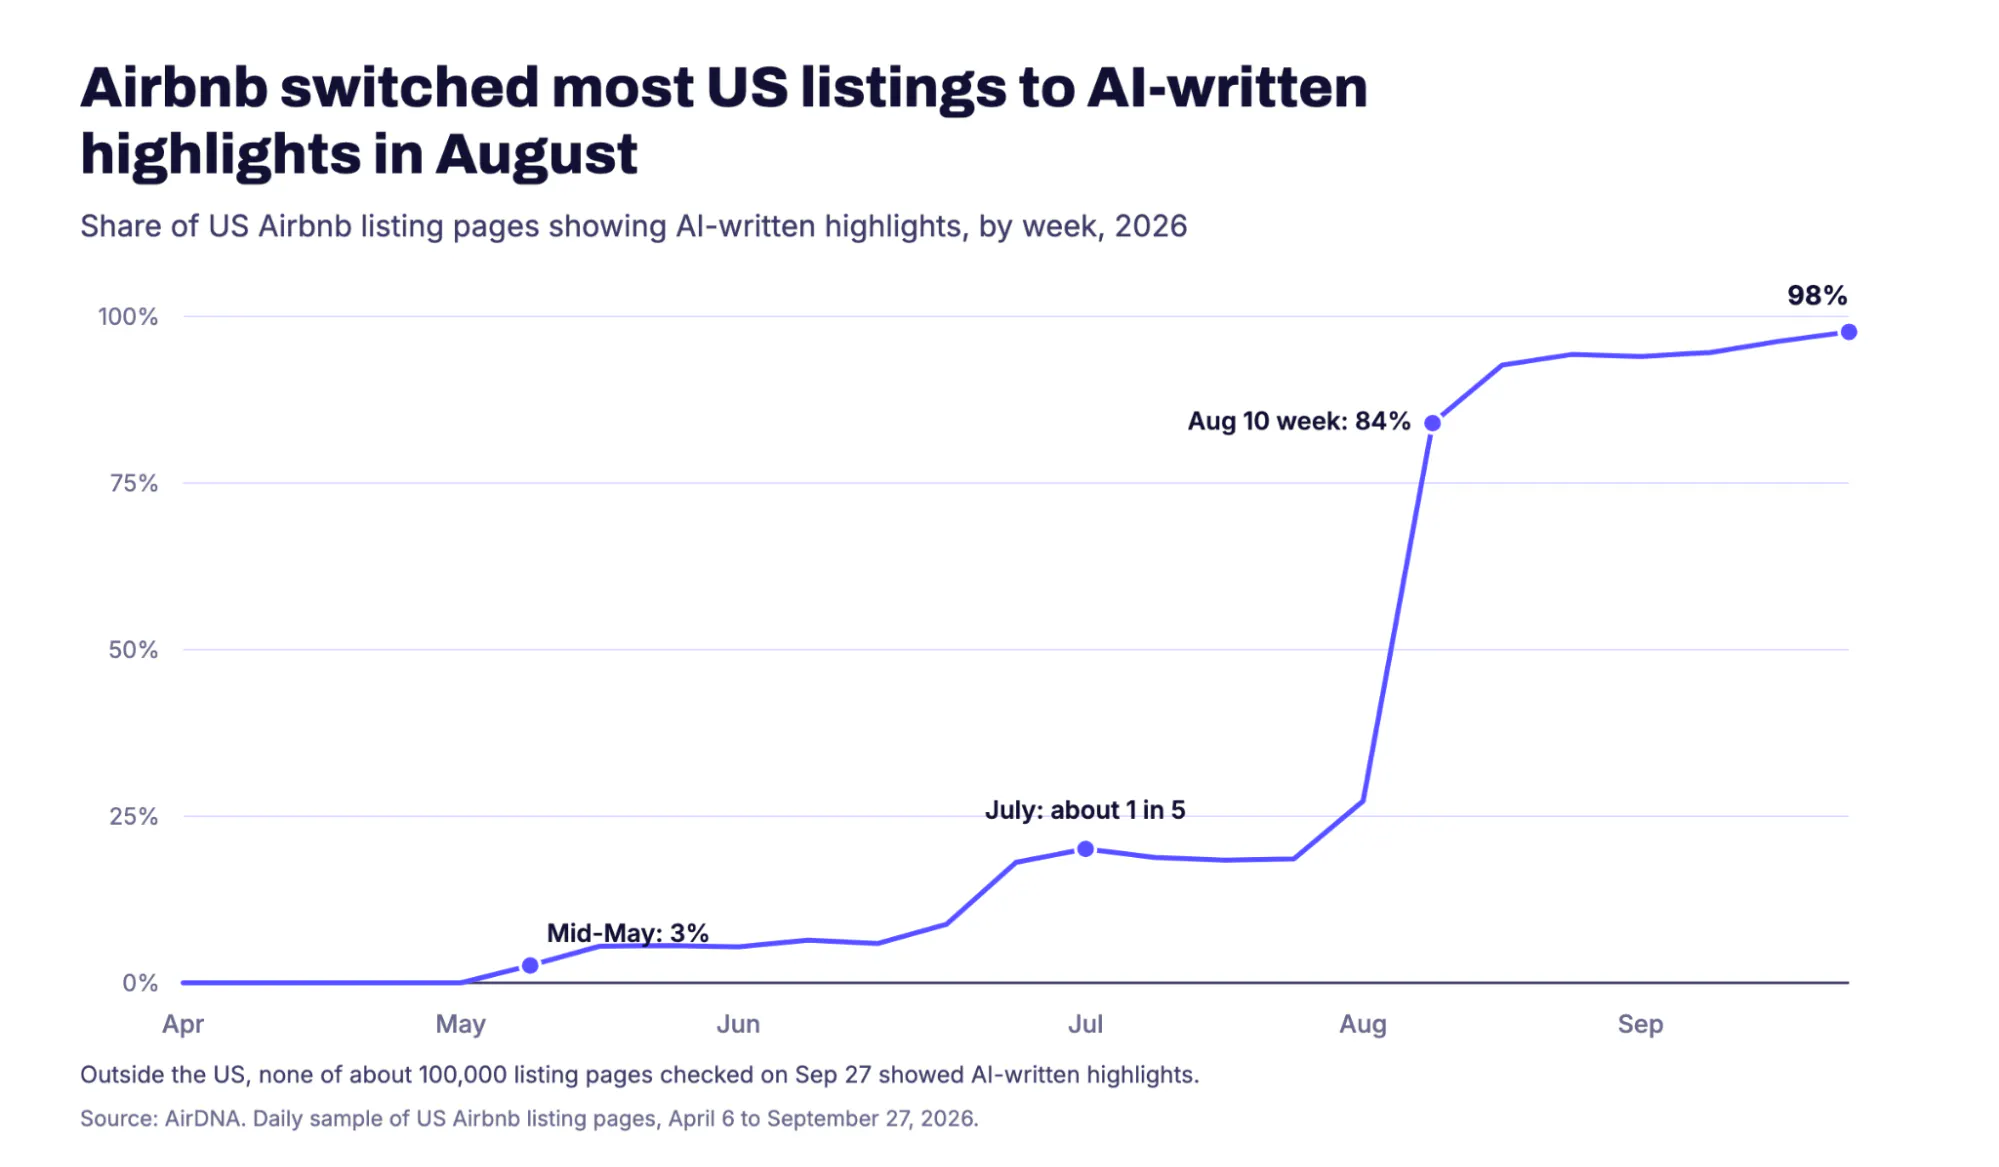
- In the U.S., Airbnb moved almost every listing to AI-written highlights between May and September 2026, while non-U.S. listings still use the standard set.
- Entire homes in the Top 5% and Top 10% tiers earned about 13% to 14% more RevPAR than non-Guest Favorite homes in the same city.
- Top 1% homes averaged about 3.5 Airbnb reviews a month, close to four times as many as homes that aren’t Guest Favorites.
Self Check-In Is the Most Common Airbnb Listing Highlight
Self check-in is the most common by a wide margin, on about 36% of listings. Next come two amenity lines, “Dive right in” for a pool and “Park for free”, each on about 15%. Then there’s a cluster at around 12%: a great or exceptional check-in rating, a view, and Superhost status.
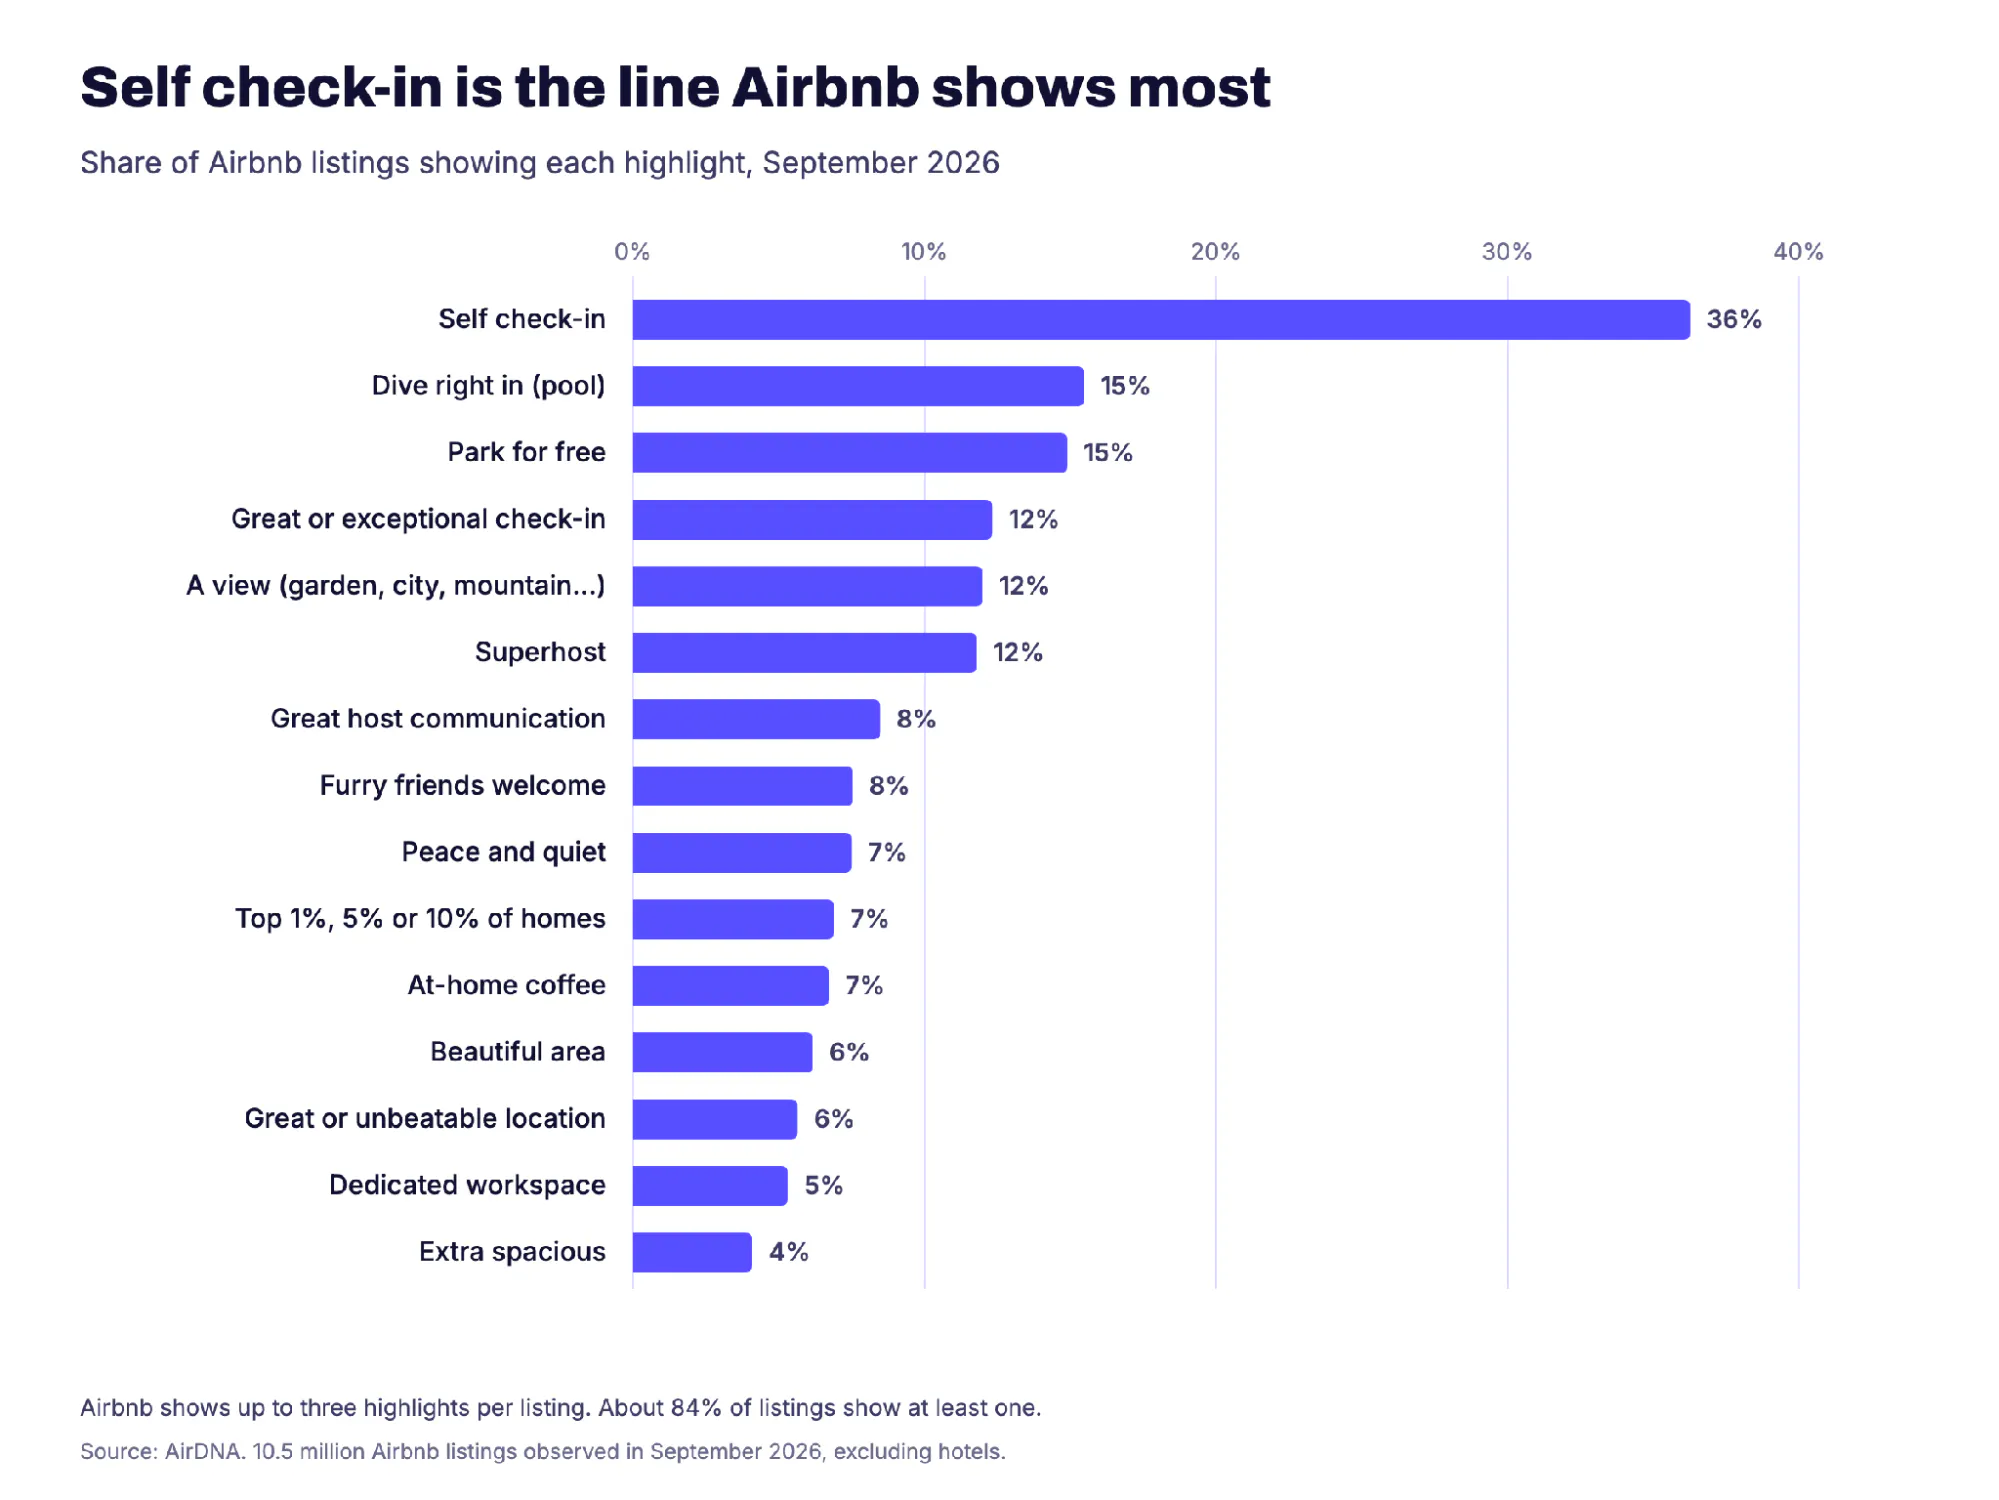
Grouped together, the biggest source is guest reviews. About 28% of all the highlights shown repeat something reviewers said or rated highly: a quiet or beautiful area, a smooth check-in, good communication, a great location, or a home that felt extra spacious. The area lines come in nine versions, led by “Peace and quiet” on about 780,000 listings and “Beautiful area” on about 640,000.
Amenities Airbnb treats as sought-after (a pool, free parking, pets allowed, a hot tub) make up another 20%, and arrival logistics such as self check-in 18%. Status badges, meaning the Guest Favorite tiers and Superhost, account for about 9%.
Some highlights are there to set expectations. About 900,000 listings, almost all private rooms, get lines such as “Shared bathroom” or “Shared common spaces”. Those fill about 8% of all the slots, roughly as many as views and scenery do.
In Tulum, Four in Five Listings Are “One of the Few” With a Pool
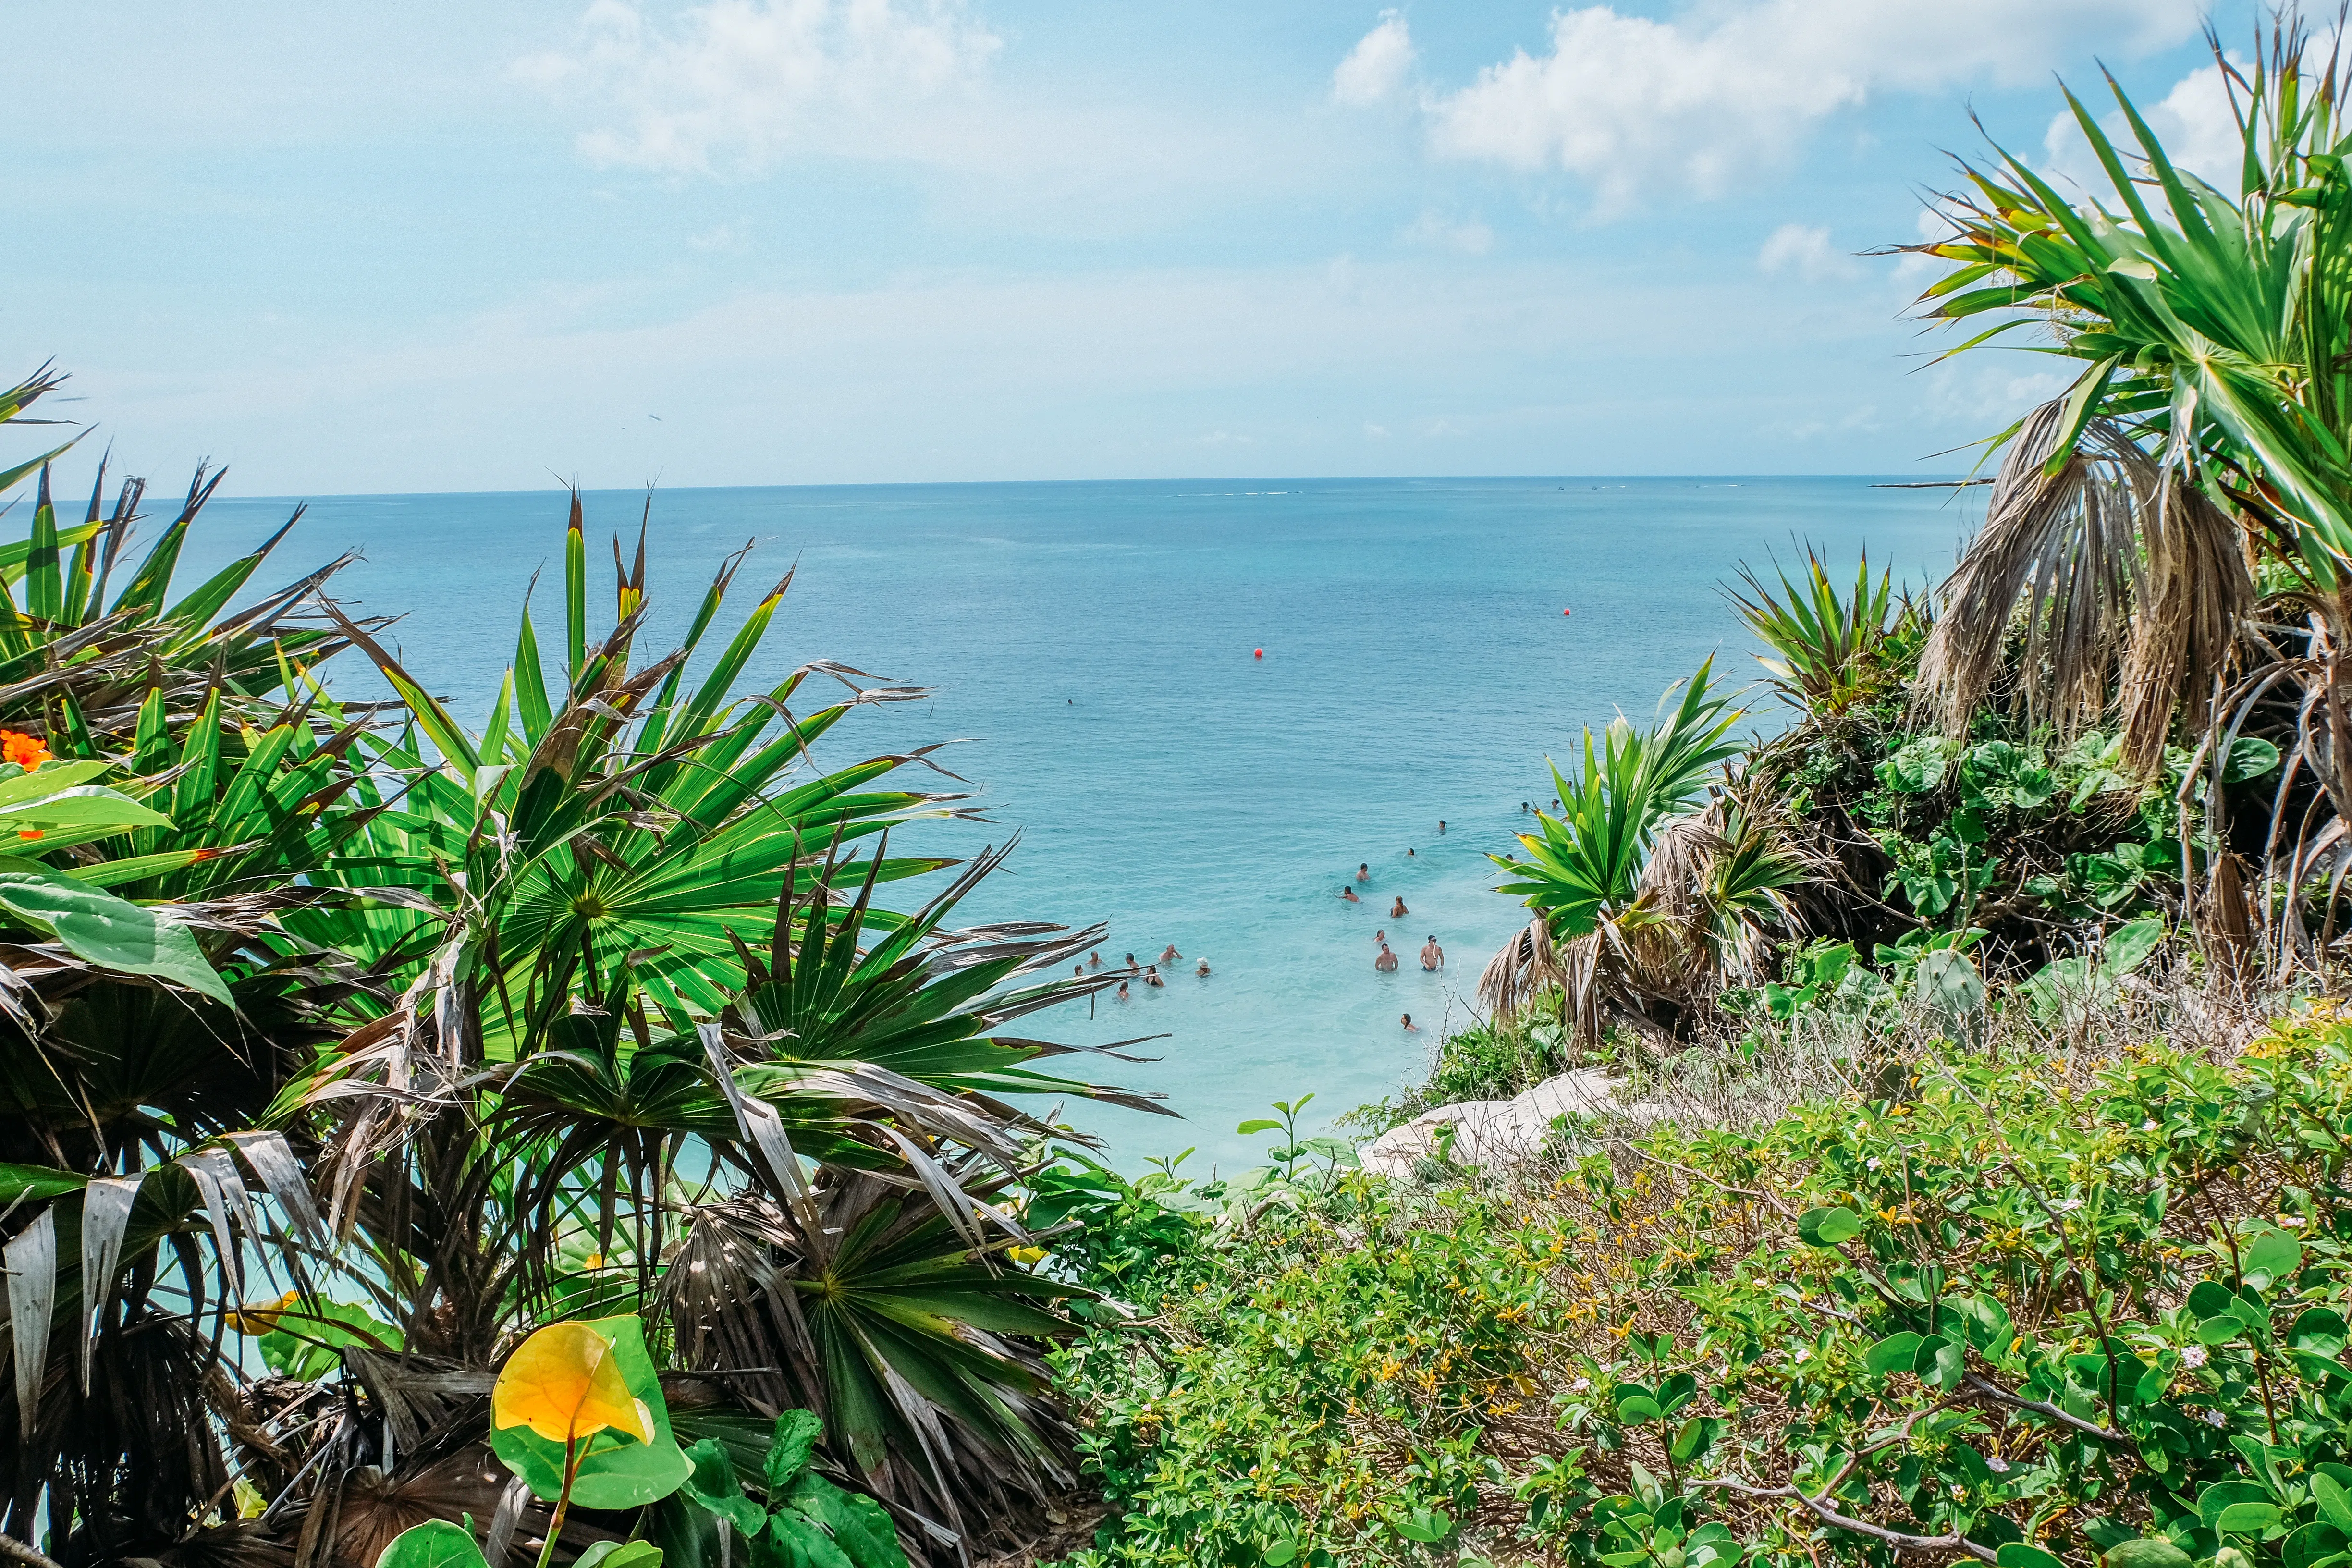
The pool highlight reads “This is one of the few places in the area with a pool.” In some markets, most listings carry it. In Tulum, Mexico, about four in five listings show the line, and Acapulco and Dubai are close behind at 77% to 79%. When most of a city’s homes are “one of the few,” the line tells a guest the home has a pool but says little about how rare that is.
The opposite case stands out too. U.S. and French listings almost never get the pool or free-parking lines: under 1% in the U.S. and effectively none in France, against roughly a third of listings in Brazil, Spain and Mexico for the pool line alone. Scottsdale, Arizona, and Kissimmee, Florida, two of the most pool-heavy markets in the U.S., show none. Airbnb doesn’t run the same set of highlights everywhere.
In the U.S., AI Now Writes Most Airbnb Listing Highlights
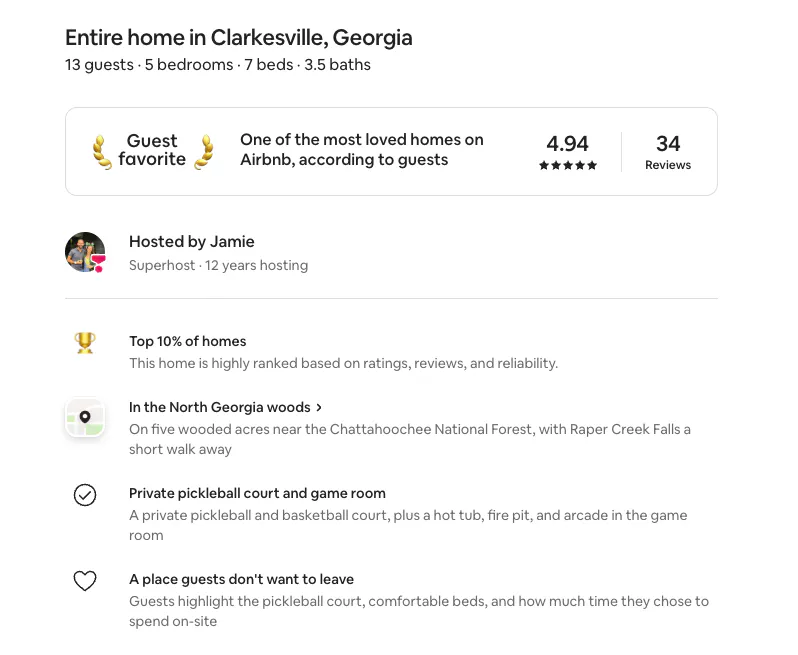
My own listing in North Georgia doesn’t show any of the lines above. Under the Top 10% badge are three that Airbnb wrote for the home: “In the North Georgia woods”, “Private pickleball court and game room” and “A place guests don’t want to leave”. The first comes from where the home is, the second from its amenities, and the third from what guests wrote in their reviews (“Guests highlight the pickleball court, comfortable beds, and how much time they chose to spend on-site”).
Airbnb has been swapping its standard highlights for generated ones across the U.S. since May. In mid-May about 3% of the U.S. listing pages we collected had them. By July it was about one in five, and in the week of August 10 it jumped to 84%. By late September it was about 98%. Outside the U.S. I found none: every highlight on about 100,000 non-U.S. pages we checked on September 27 still came from the standard set.
That explains the missing pool and parking lines in the U.S. The standard lines have mostly gone, and self check-in, which was on about two-thirds of U.S. pages in June, is down to about 1%.
The generated lines change, too. Mine has been reworded in four of our last five weekly checks. “In the North Georgia mountains” became “In the North Georgia woods”, and “A place you won’t want to leave” became “A place guests don’t want to leave”.
Some of the page is still standard. The Guest Favorite banner, the rating and review count, Superhost status and the Top 1%, 5% or 10% line work the same way they do everywhere else, and the tier line still takes the first slot. I also don’t see signs that the text is tailored to each guest. AirDNA’s copy of my page, collected as an anonymous visitor, matches exactly what I see as the host, so it looks like one version per listing, refreshed about once a week. I can’t rule out that some guests or searches see something different.
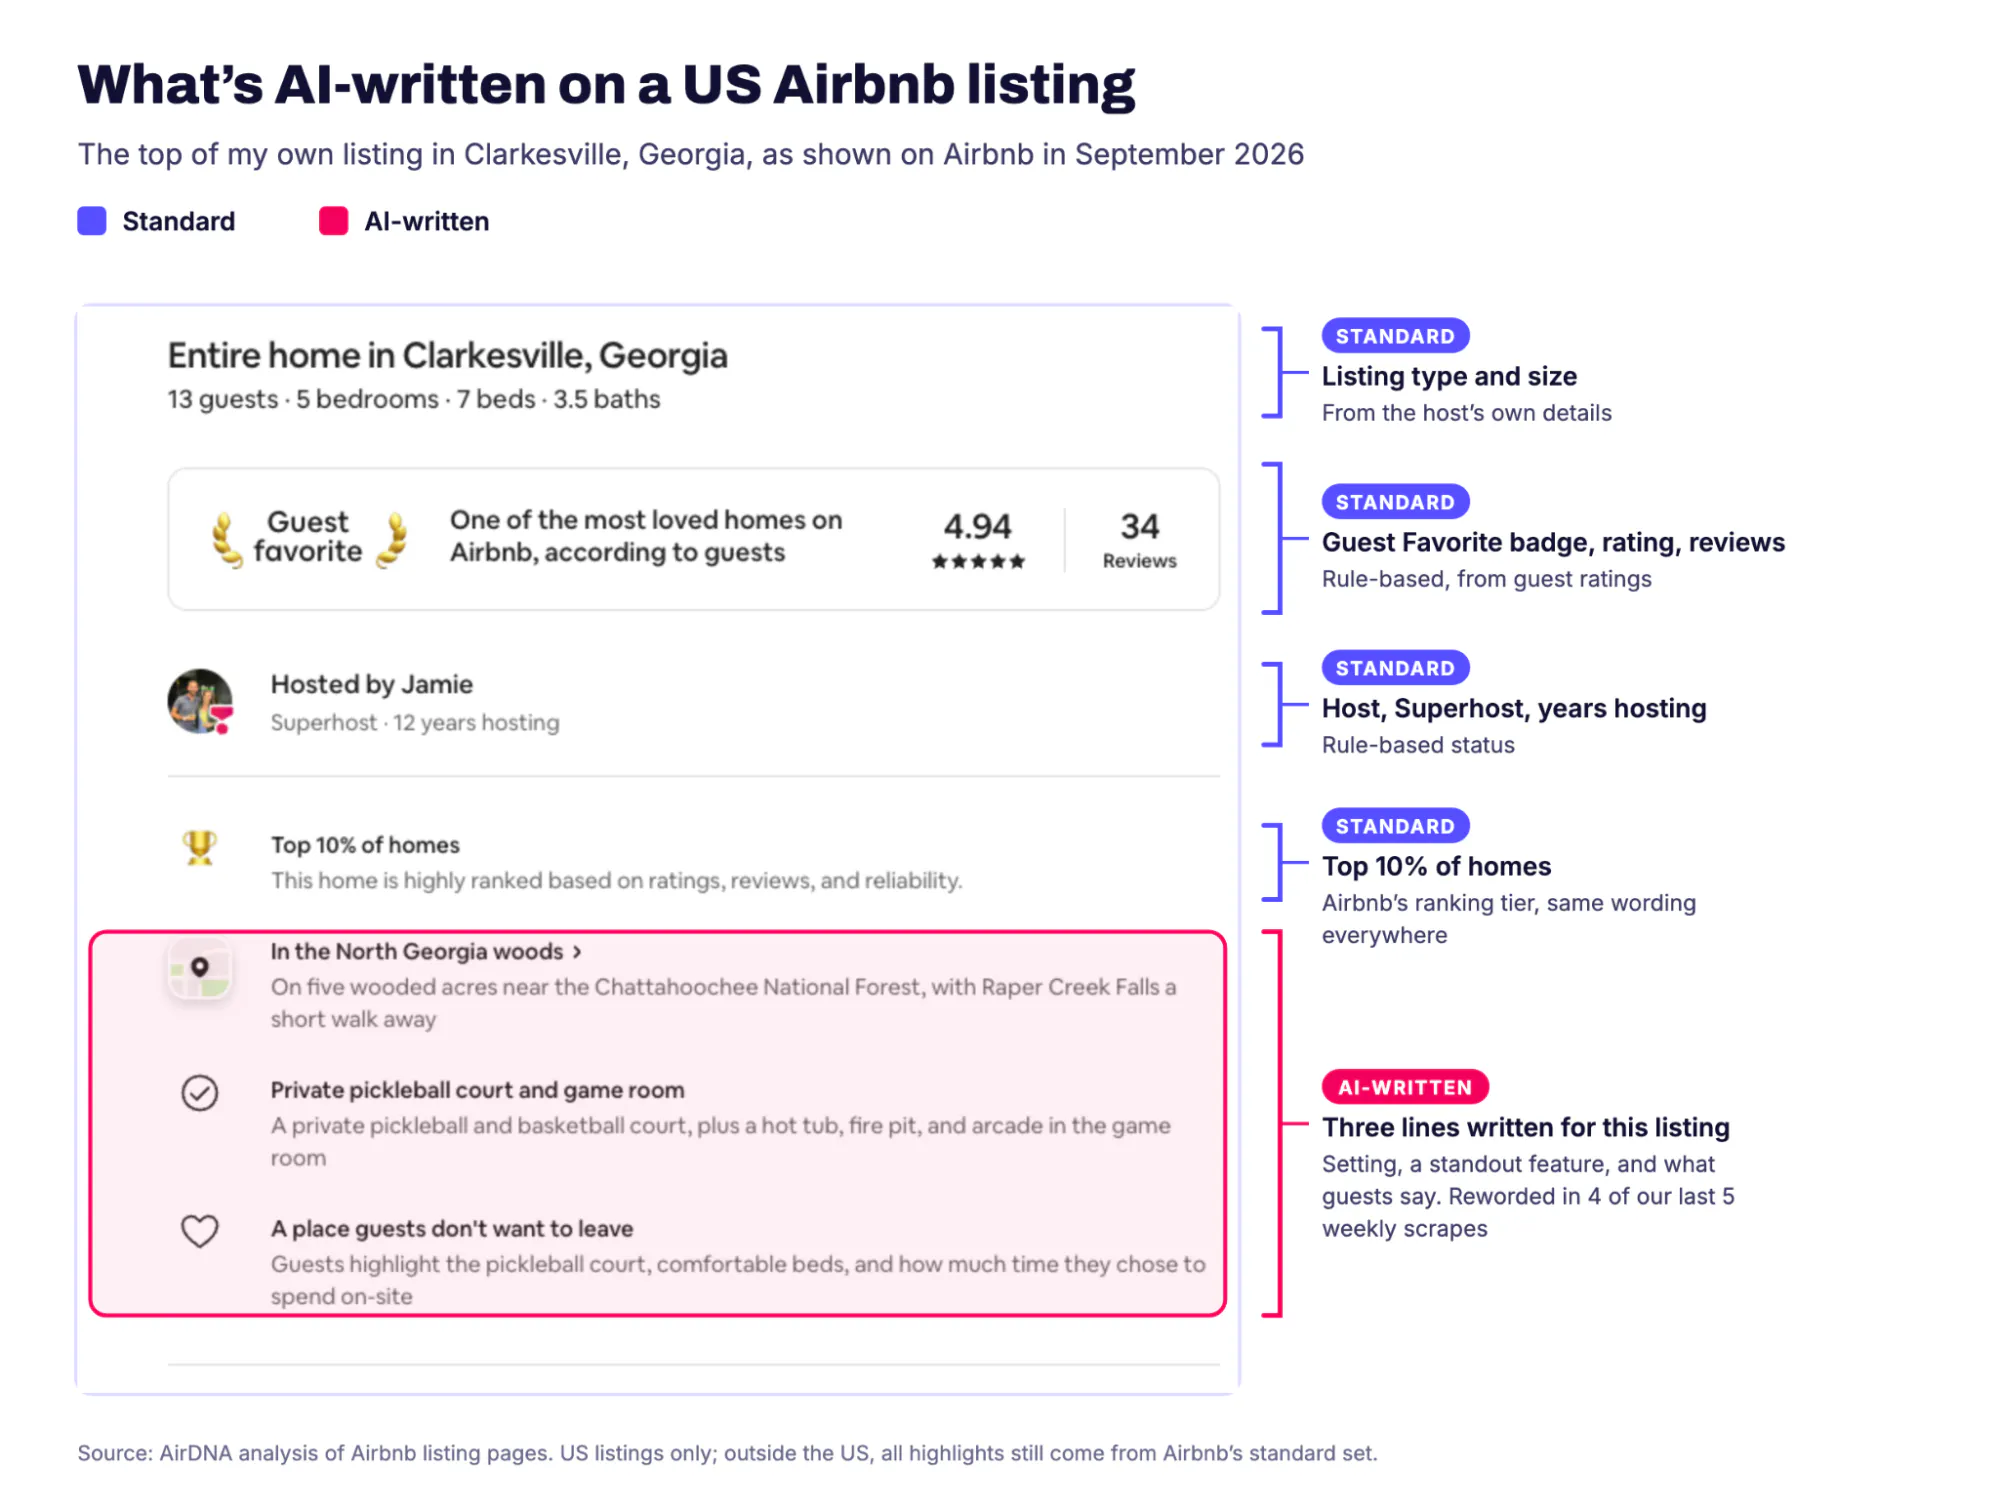
For U.S. hosts, this changes what shapes those lines. They no longer come from a fixed menu like “Self check-in” or “Park for free”. They appear to be written from the listing’s details and what guests say in reviews, so a clear listing description and the things guests mention in reviews count for more than the right box ticked in the amenity list.
Some Highlights Name National Parks and Guest Nationalities
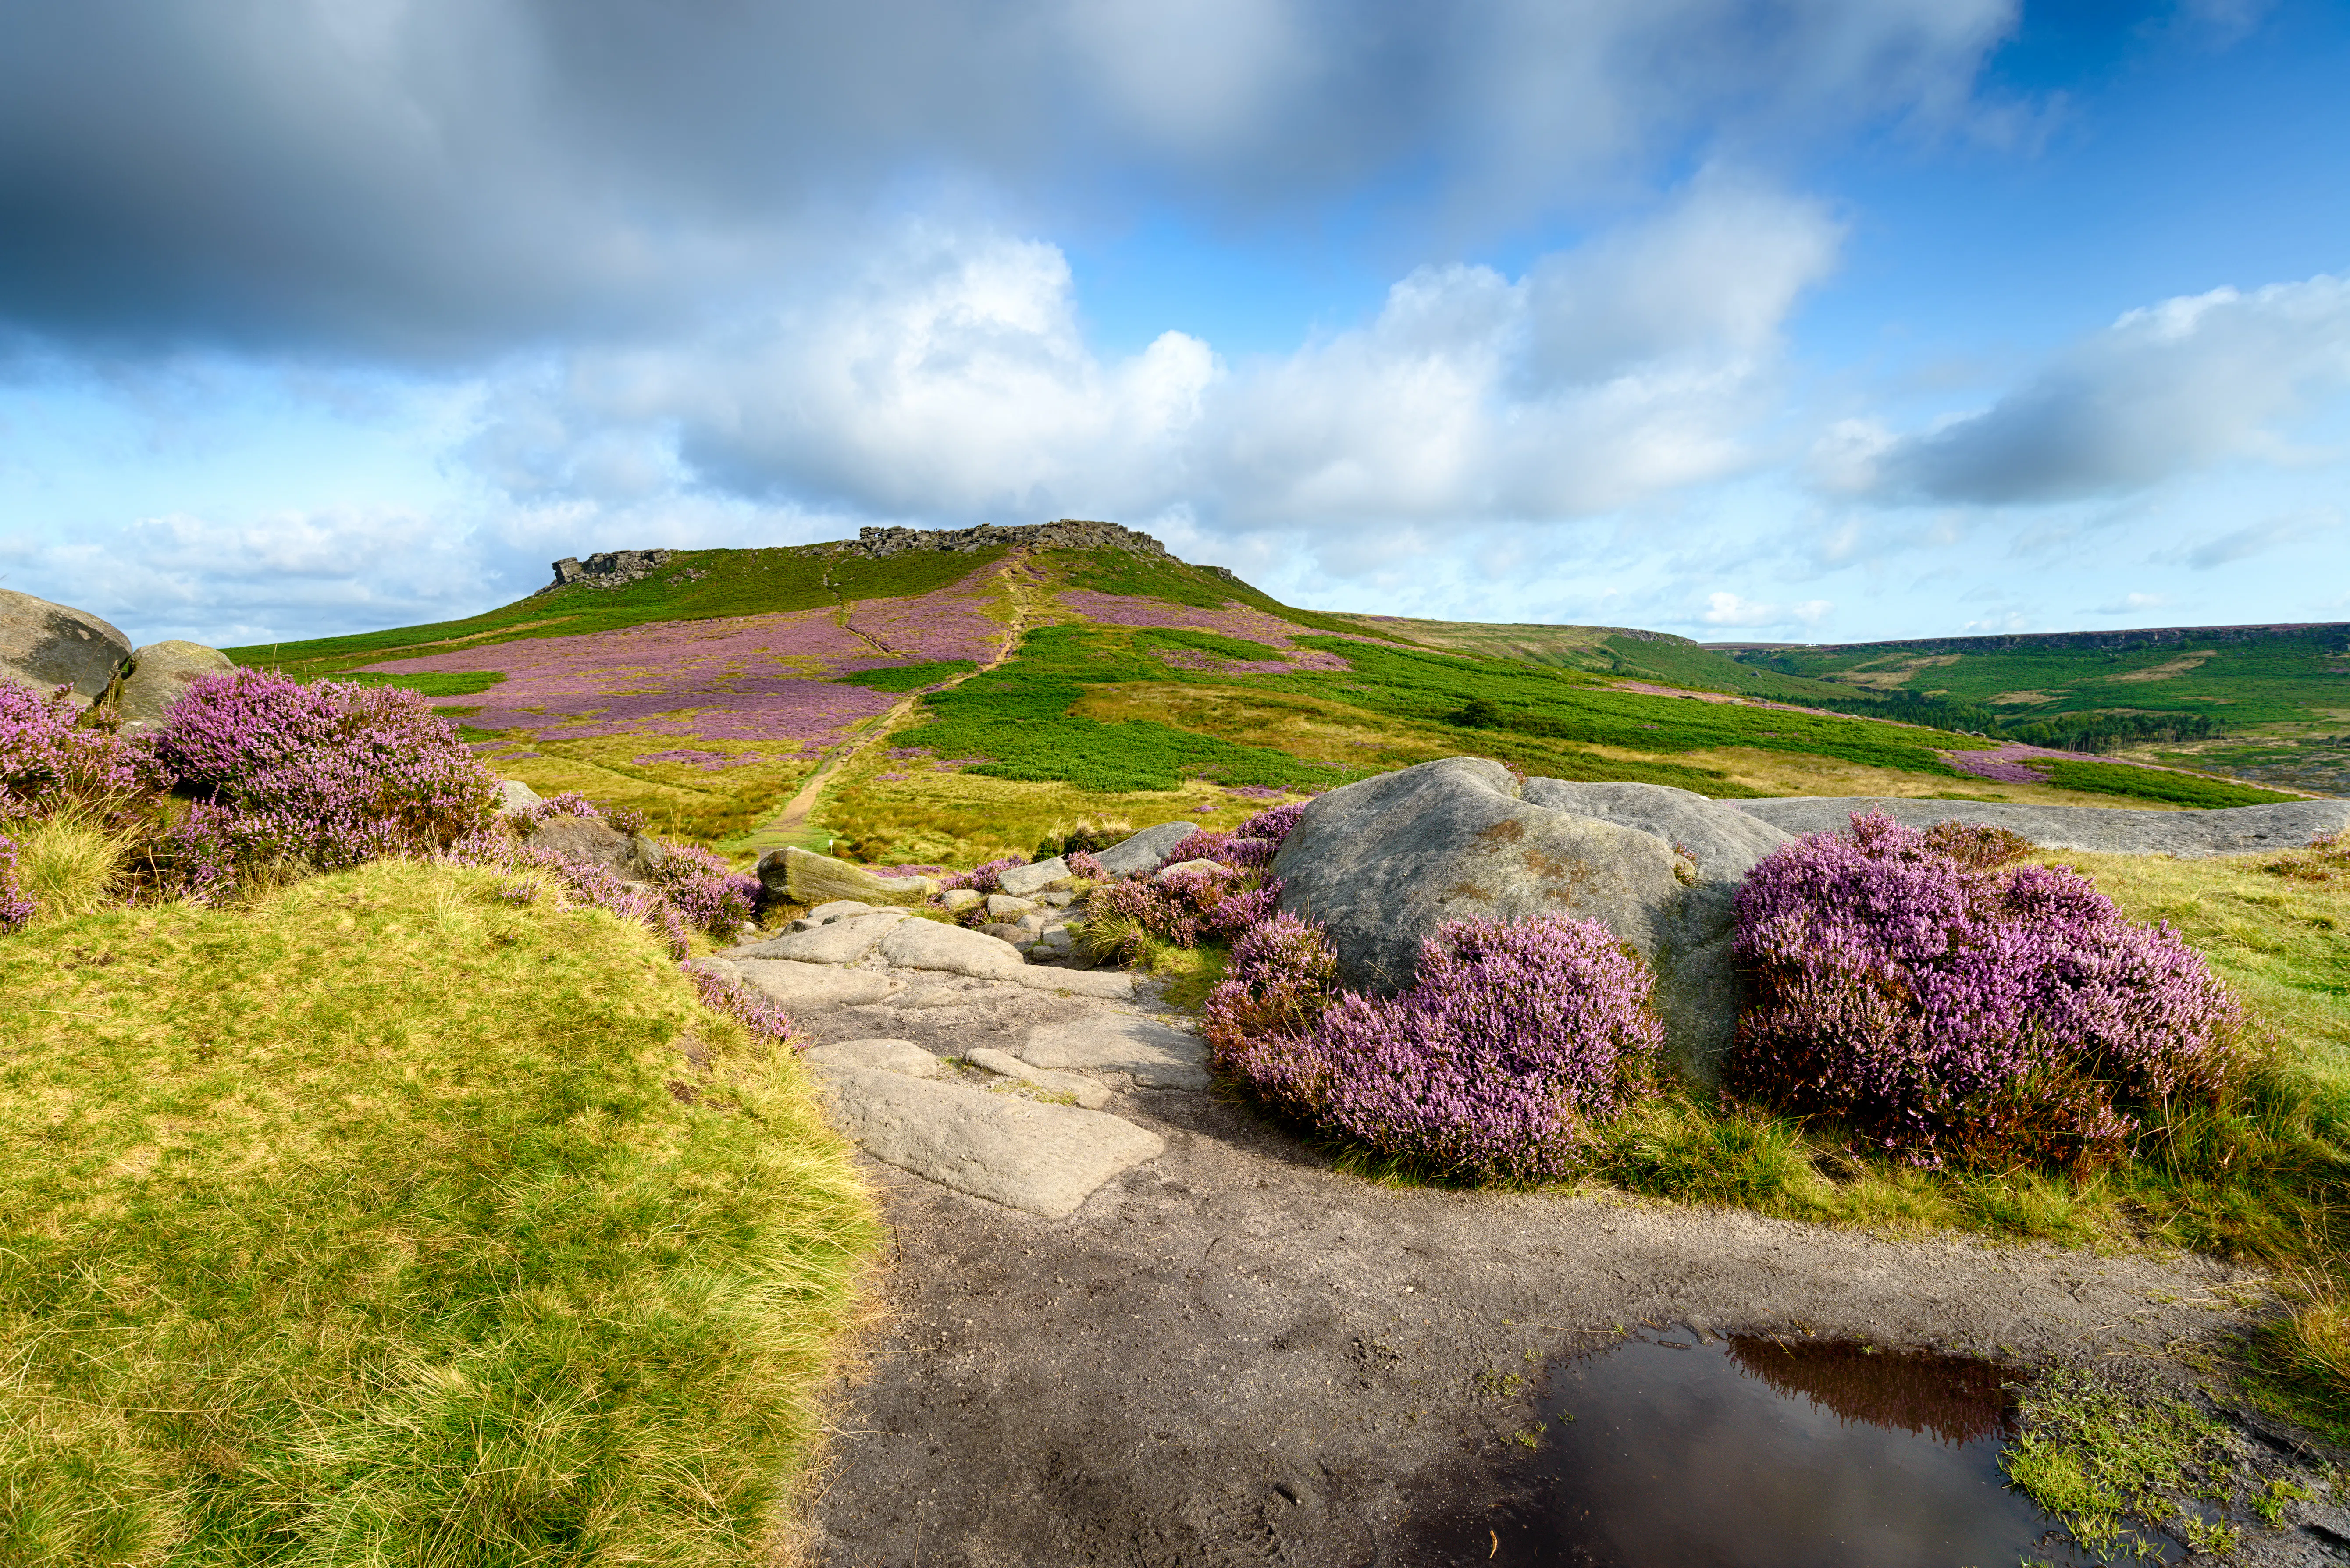
National parks get their own highlight, with a drive time: “30-min drive to Great Smoky Mountains National Park”. The U.K. has more listings with one than the U.S., about 115,000 against 81,000, led by the Peak District, the New Forest and the North York Moors. In the U.S., Great Smoky Mountains and Joshua Tree lead.
Some listings are “Top-rated by guests from” a named country, which appears when every guest from that country in the past year gave five stars. It’s on about 6,500 listings, and it’s always a cross-border compliment: German guests on Italian and French homes, French guests on Italian, Spanish and Moroccan ones. Germany is named on about 3,600 listings, more than twice as often as France.
Airbnb also leaves out plenty it could say. Only about a third of Superhost listings get the Superhost line. Superhosts with fewer than three highlights usually do get it, so on the rest it looks like it loses out to other lines. And Airbnb’s Icons listings get custom highlights written for them. The X-Men mansion’s include “Try Cerebro on for size.”
Top 5% and Top 10% Homes Earn About 13% to 14% More RevPAR
Highlights are the part of a listing a guest takes in at a glance, and the Guest Favorite tiers line up with better results. I compared entire homes in each tier with homes in the same city that aren’t Guest Favorites, over the 12 months to August 2026. Homes in the Top 5% and Top 10% earned about 13% to 14% more revenue per available night (RevPAR). Guest Favorites that don’t show a tier earned about 6% more.
The Top 1% surprised me. Those homes booked about 18% more nights than their neighbors, at an average daily rate about 6.5% lower, so their RevPAR edge of about 10% is smaller than the tier below. The badge’s own text says the ranking is “based on ratings, reviews, and reliability.” My guess is that a home that books often at a fair price builds up exactly those.
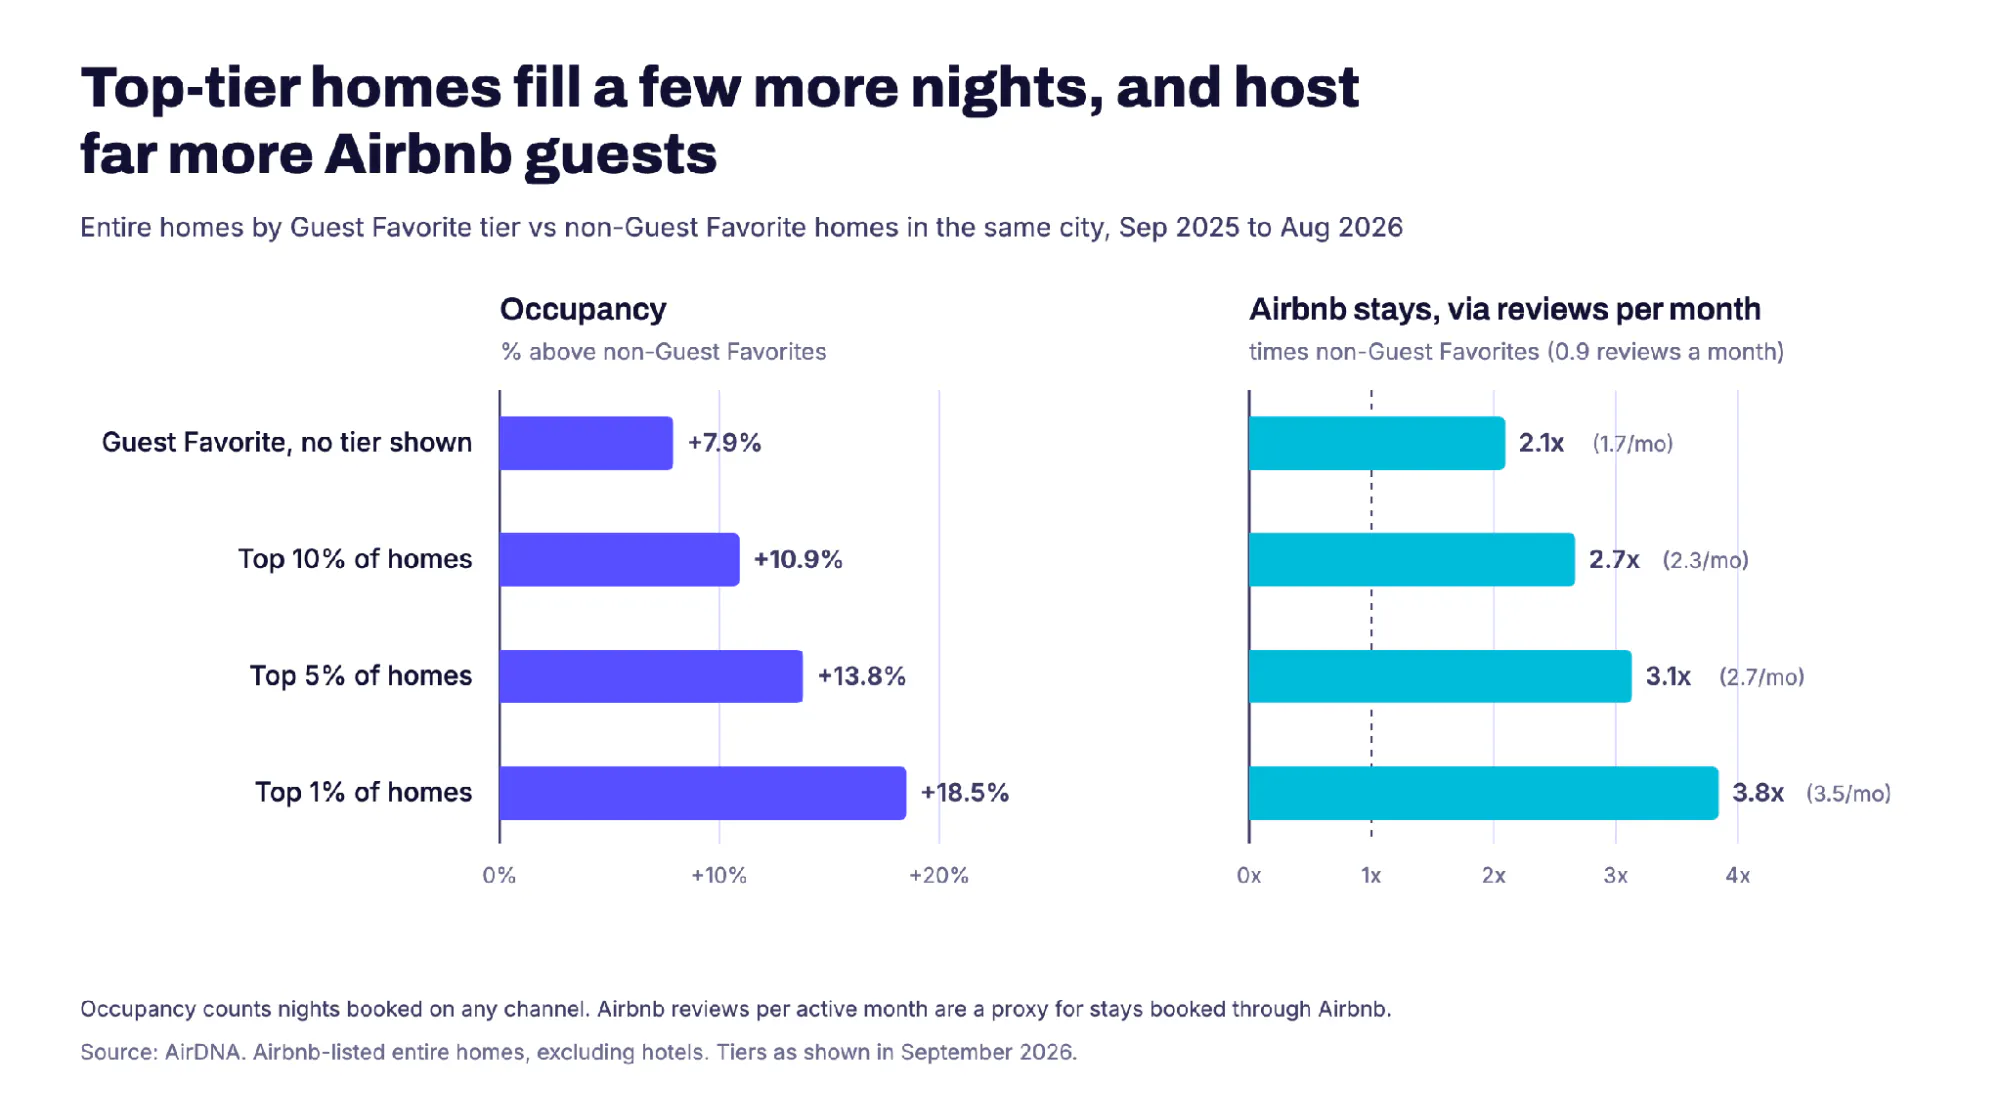
Occupancy can only rise so far, since a home can’t be booked more than every night. The gap in Airbnb guests is much wider. I use Airbnb reviews as a stand-in for stays booked through Airbnb, since most guests leave one but not all. Homes that aren’t Guest Favorites averaged about 0.9 Airbnb reviews a month over the year. Top 10% homes averaged about 2.3, and Top 1% homes about 3.5, close to four times as many as their neighbors.
Some of that comes from how the tiers work, because reviews feed the ranking, and guests who loved a stay are probably more likely to write one. Even so, the gap is far wider than the gap in occupancy. The top tiers also have shorter stays, about 3.7 nights on average for the Top 1% against 4.6 for homes that aren’t Guest Favorites, so they turn over more often and host more Airbnb guests for the same number of booked nights.
None of this shows the badge causes the extra bookings. Airbnb awards it for the same things that fill calendars, so the two move together.
What Hosts Can Do to Shape Their Highlights
For hosts, a good share of the highlights come from things you control. Self check-in, the amenity list, and the check-in and communication ratings in your reviews all feed lines that appear on millions of listings. Others, such as a view or “Peace and quiet”, depend on where the home is and what guests write about it. If your home has something guests care about and no highlight mentions it, check that it’s in your amenity list.
One new type turned up in September: “Experienced host”, which tells guests how many reviews the host has on their other listings. It’s on three listings so far, which looks like a test. I’ll be watching whether it spreads.
About the data: AirDNA observed the listing pages of about 10.5 million Airbnb listings in September 2026, excluding hotels. Shares are of all those listings. The performance comparison covers Airbnb-listed entire homes, using AirDNA’s Airbnb and Vrbo performance data from September 2025 to August 2026. Each tier is compared with non-Guest Favorite entire homes in the same city, and results are weighted by available nights. Airbnb reviews are counted by review date over the same 12 months, per month the listing was active, as a proxy for stays booked through Airbnb. Japan is excluded from the performance comparison.
FAQs
What are Airbnb listing highlights?
Airbnb listing highlights are the up to three short lines, each with an icon, that appear near the top of a listing, such as “Self check-in” or “Top 5% of homes”. Airbnb picks them, not the host, based on the home, its reviews and nearby listings. In September 2026, about 84% of the 10.5 million listings AirDNA observed showed at least one.
What is the most common Airbnb highlight?
Self check-in, on about 36% of listings in September 2026. The pool line (“Dive right in”) and “Park for free” follow at about 15% each. Grouped by source, lines drawn from guest reviews make up the largest share, about 28% of all highlights shown.
Does Airbnb use AI to write listing highlights?
In the U.S., yes. Airbnb began replacing its standard highlights with generated ones in May 2026, and by late September about 98% of the U.S. listing pages AirDNA collected showed them. They appear to be written from the listing’s details and guest reviews, and they are reworded often. Outside the U.S., none of about 100,000 pages checked on September 27 had them.
Do Airbnb’s Top 1%, 5% and 10% homes earn more?
Yes, on average. Over the 12 months to August 2026, entire homes in the Top 5% and Top 10% tiers earned about 13% to 14% more RevPAR than non-Guest Favorite homes in the same city. Top 1% homes booked about 18% more nights at an average daily rate about 6.5% lower, for a RevPAR edge of about 10%. The badge doesn’t necessarily cause the gain, since Airbnb awards it for the same things that fill calendars.
How do you get the Guest Favorite badge on Airbnb?
Airbnb says its Top 1%, 5% and 10% ranking is “based on ratings, reviews, and reliability.” In AirDNA’s data, top-tier homes collect far more reviews: Top 1% homes averaged about 3.5 Airbnb reviews a month, against 0.9 for homes that aren’t Guest Favorites. Strong check-in and communication ratings also feed highlights shown on millions of listings.
ARTICLE SUMMARY
Airbnb shows up to three listing highlights near the top of most listings, and AirDNA’s Jamie Lane analyzed them across about 10.5 million listings in September 2026. Self check-in is the most common line, U.S. listings switched almost entirely to AI-written highlights in 2026, and entire homes in the Top 5% and Top 10% tiers earned about 13% to 14% more RevPAR than their neighbors.
Jamie Lane
AirDNA Chief Economist
He is responsible for data analysis, thought leadership, and leveraging advanced analytical techniques to provide new insights into short-term rental market trends. Native to Atlanta and an Airbnb host himself, Jamie enjoys cycling, mountain biking, backpacking, running, and playing in a dart league in his free time.