

 Calculate Revenue
 Research Markets
 Find For Sale Properties
 Compare My Listing
 STR Revenue Calculator
 Custom Comp Sets
 Submarket Insights
 Custom Search Filters
 Rate Recommendations
 Performance Benchmarking
 Competitor Comparison
 Owner Contact Details
 Property-level performance data
 Tourism Insights
 Real Estate Investment Analytics
 About Us
 Sales
Sales Support
 Press
PressI'm an AirDNA Analyst and I Own a Short-Term Rental. Here's Exactly How I Researched It.
Published: August 20, 2026
Last updated: August 24, 2026

Linda Rollins
What I'd tell you before you start
- I bought my short-term rental with the same AirDNA subscription anyone can buy. Nothing I used to find it was internal.
- Filtering did more for my research than anything else I tried. An unfiltered market average lumps the 5-bedroom lakefront place in with the studio above someone's garage, and I would not bet $400K on that number.
- My $65K revenue projection has held up because I built the ideal comp set. Seven months in, we are running about $5K ahead of it.
- The features that changed my research the most are the ones people skip: the property rating and days-available filters, the yield heat map, and editing your own Rentalizer comps.
Every week, people ask us the same question: How do I use AirDNA to find a good short-term rental investment?
It's a fair question. AirDNA gives you access to 15M+ active listings across 120K+ markets, but knowing what to do with all of it is the next step.
Last year I used that same data to buy a short-term rental of my own. What follows is the exact process I ran, along with the features, filters, and research techniques that got me to the right property.
How I went from research analyst to short-term rental owner
Hi! I'm Linda Rollins, a Senior Research Analyst at AirDNA. I finally bought a short-term rental of my own last year, after spending three years telling investors what the numbers said.
When I started at AirDNA, I was new to data analytics and hungry for a good dataset. Being granted access to data on every short-term rental property in the world was surreal. I remember thinking, how often do you get a whole industry at your fingertips? I was one query away from understanding how short-term rentals were performing in any market across the globe.
If I wanted the best markets in every state to buy a short-term rental, I could find them and pinpoint the right neighborhood. Whether the 1-bedroom A-frame or the 5-bedroom cabin was the better buy, which amenities were worth the money, whether luxury properties were beating budget ones, how much any individual listing in an area actually earned: all of it was right there. The world really did feel like my oyster.
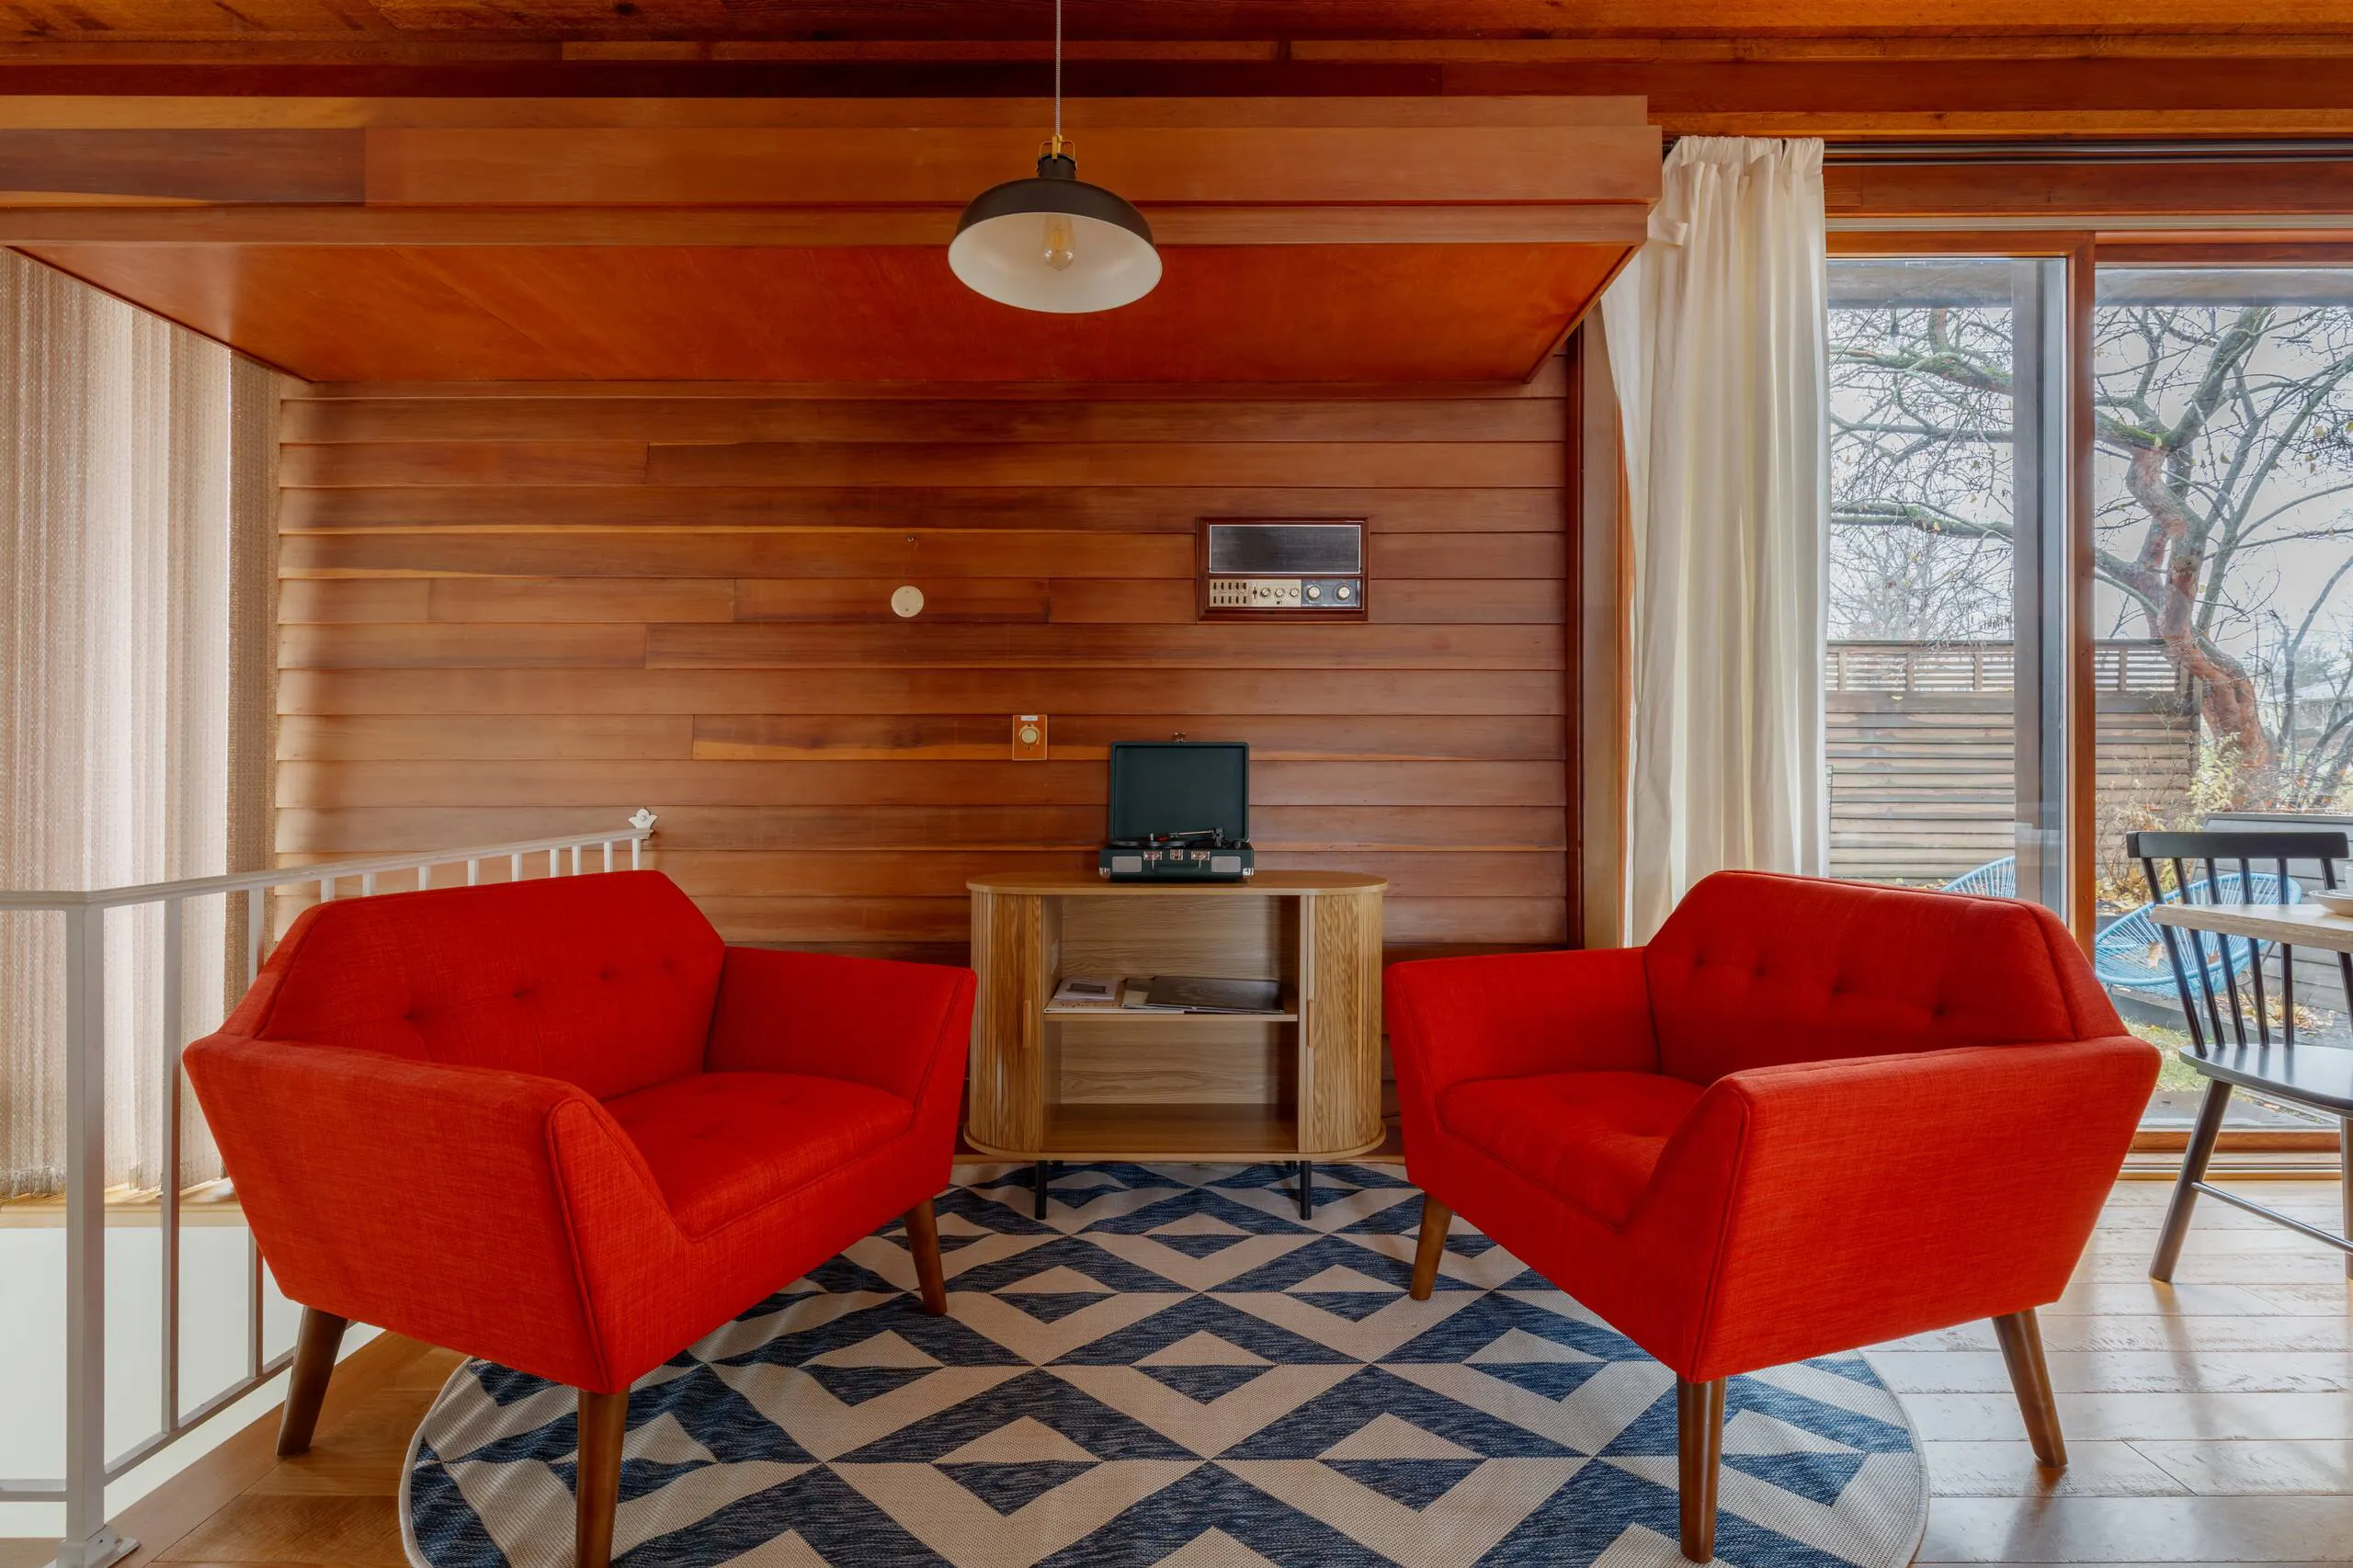
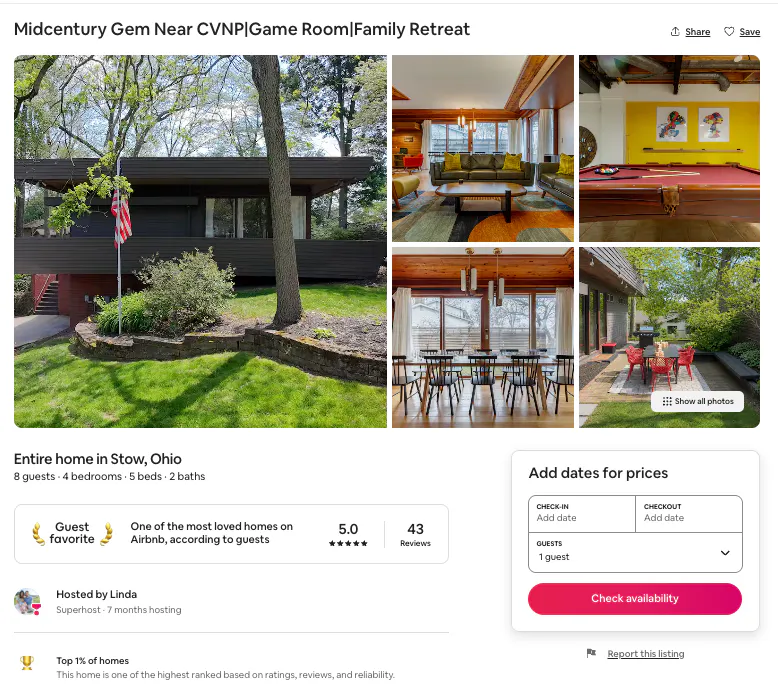
You can imagine it didn't take me very long to realize that I really wanted a short-term rental. With every analysis, I became more confident in the idea and clearer on exactly what it would look like. Finally, in September of 2025, my husband and I closed on Treeside Retreat, a 4-bedroom mid-century modern home in Ohio, 10 minutes from Cuyahoga Valley National Park. We wanted to host family and group getaways to the national park, and hoped that our proximity to it and the unique mid-century architecture and design of our home would help us succeed as first-time short-term rental investors.
The truth is, the data I have access to as a research analyst is readily available to all AirDNA subscribers. That wasn't always true. When I joined the company, a subscription got you access to one market. Now Pro subscribers get global access: the same 15M+ active listings across 120K+ markets that I work with every day, at both market and property level. You can have the whole industry at your fingertips too. Knowing what to do with all of it is the next step.
Today I'm going to walk you through how to use AirDNA to find your next short-term rental investment property. There is a free tier, but you'll need a Pro subscription to access many of the capabilities I'll be going over. I'll cover my journey in finding a property, my biggest tips for navigating the software, and some of the key features that many AirDNA users miss.
My goal is that you'll walk away with insights that take your short-term rental research to the next level, and that you avoid the mistakes that trip up a lot of first-time investors.
Tip 1: Know your budget, property type, and radius before you log in
Before you log into AirDNA, have an idea of what you're researching.
We have charts, maps, and tables with data on every Airbnb, Vrbo, and Booking.com property in the world, and that's genuinely overwhelming the first time you see it. We hear this from our users all the time, and it's easy to understand why. Coming in with an idea of what you're looking for will narrow your research and help prevent you from getting lost in it. You can always open your search back up once you become more familiar with the platform.
So ask yourself: What kind of property am I looking for? What's my budget for the purchase and for furnishings? Where am I willing to buy?
For my husband and me, the answers were: a 4+ bedroom home, within three hours of Columbus, Ohio, for under $400K. That became the baseline for everything that followed.
Look Up Any Market Free
Create a free account and explore ADR, occupancy, and demand trends for any market before you commit a dollar.
Tip 2: Filter before you trust any market average
Filter! Filter! Filter! It's probably the biggest tip I have to share with you. Nothing else will do more for the quality of your research. Get familiar with the market and property filters in AirDNA, because that's how you're going to refine the data you're looking at.
All the market performance data you see on our platform are averages across every property in a market. The average annual revenue figure for a market includes the 5-bedroom lakefront place and the studio above someone's garage; the property clearing $90K and the one that's barely booked; the full-time rental and the one that only lists during football season. I don't recommend basing investment decisions off an unfiltered market average, and until you filter, that's exactly what you're doing.

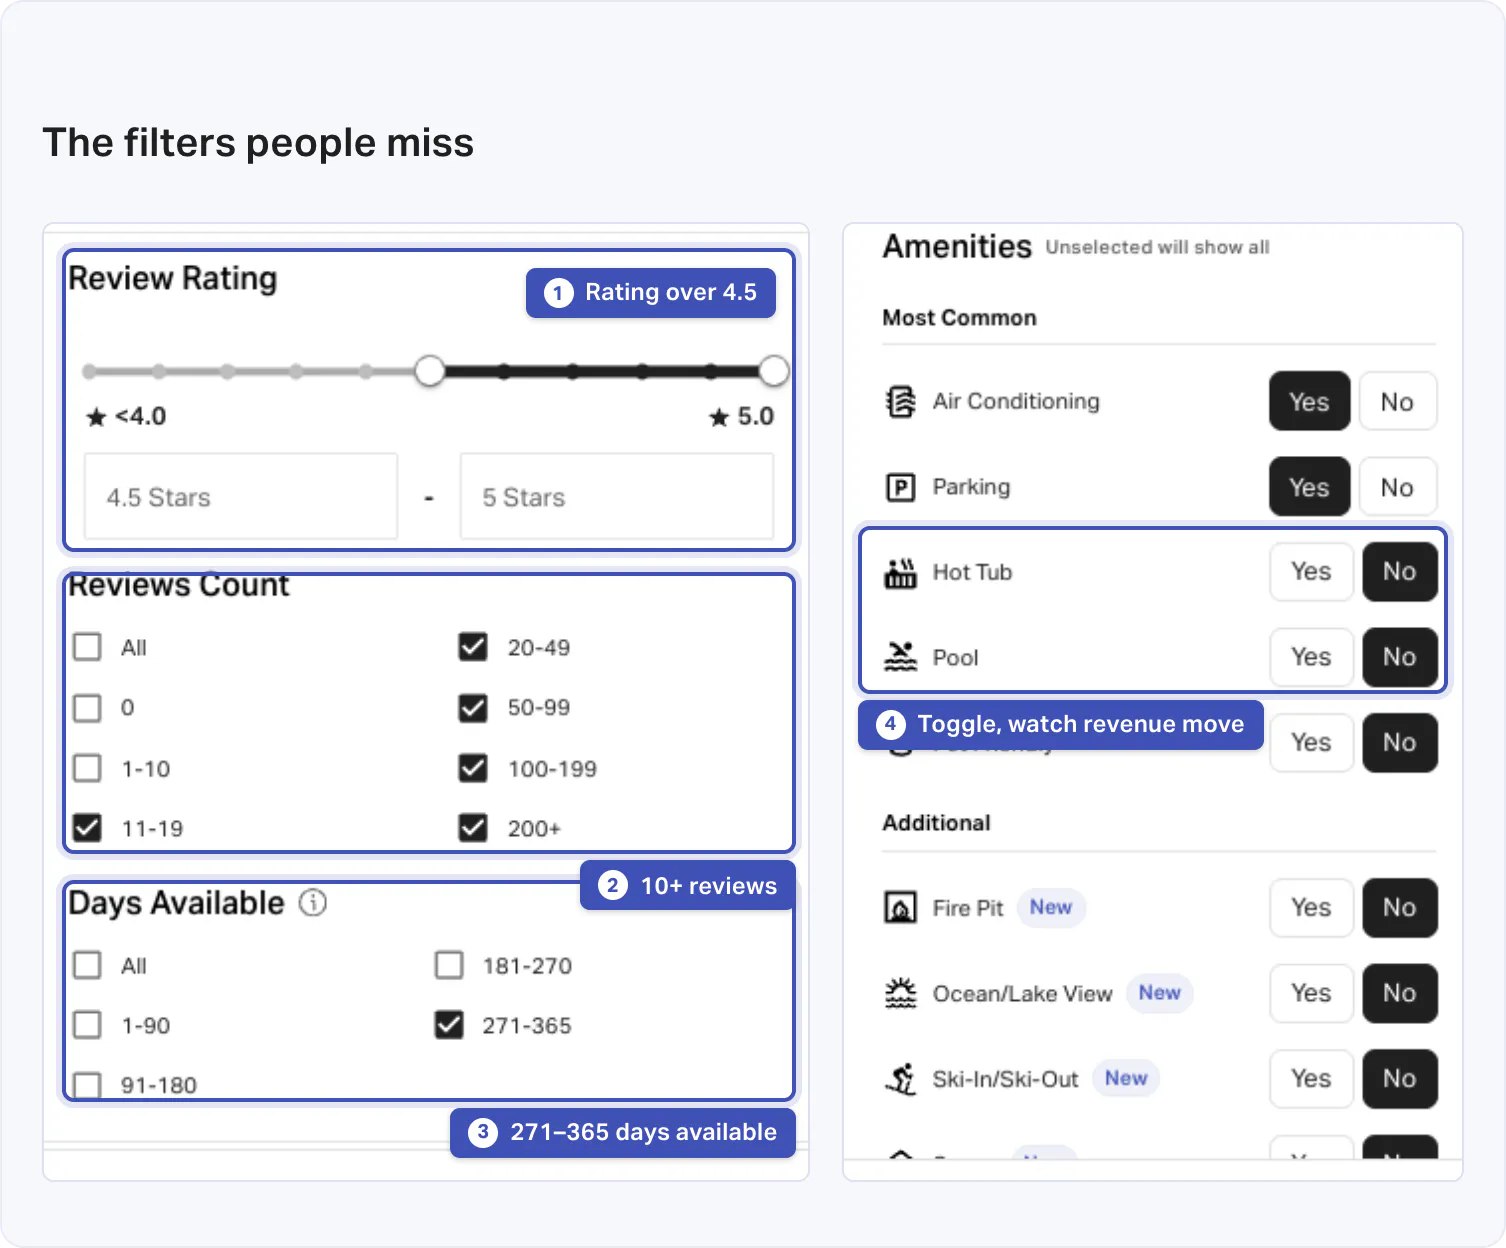
So before you look at a single chart, table, or heat map, take the criteria you walked in with and turn them into filters. AirDNA's listing filters let you narrow results by dozens of attributes, such as bedroom count, bathroom count, the number of guests the property accommodates, real estate type, and price tier. Those are the obvious ones. But here are four that often get missed and are incredibly powerful for tightening up the performance data in front of you.
- Property rating. This lets you filter out properties with low review scores. Unfortunately there are a lot of low-performing properties out there, and their revenue performance will look a lot different from what a well-run property earns. I like to filter for review scores over 4.5, so I know I'm looking at the performance of properties that are actually being managed well.
- Days available. Plenty of listings are part-time, and others are only available seasonally or during major events. If you're hoping to buy a short-term rental that will be available all year, or you're just looking for reliable figures on annual performance, you'll want to filter for properties with 270+ days of availability so part-timers don't muddle your data.
- Review count. This filter allows you to clear out properties that aren't very active or are newer to hosting. A place with only a handful of reviews usually doesn't have many bookings. I like to filter for properties with at least 10 reviews.
- Amenities. This one lets you filter properties for the amenities they do or don't have. A 4-bedroom with a pool and a hot tub is going to see very different performance than a 4-bedroom without them. This filter is useful when you have a property you'd like to buy and want to hone in on performance data for listings with the same amenities. And it's useful if you're considering adding an amenity to your property. Toggle the filter on and off and watch what happens to the revenue numbers.
Tip 3: Compare markets on price, revenue, and yield with heat maps
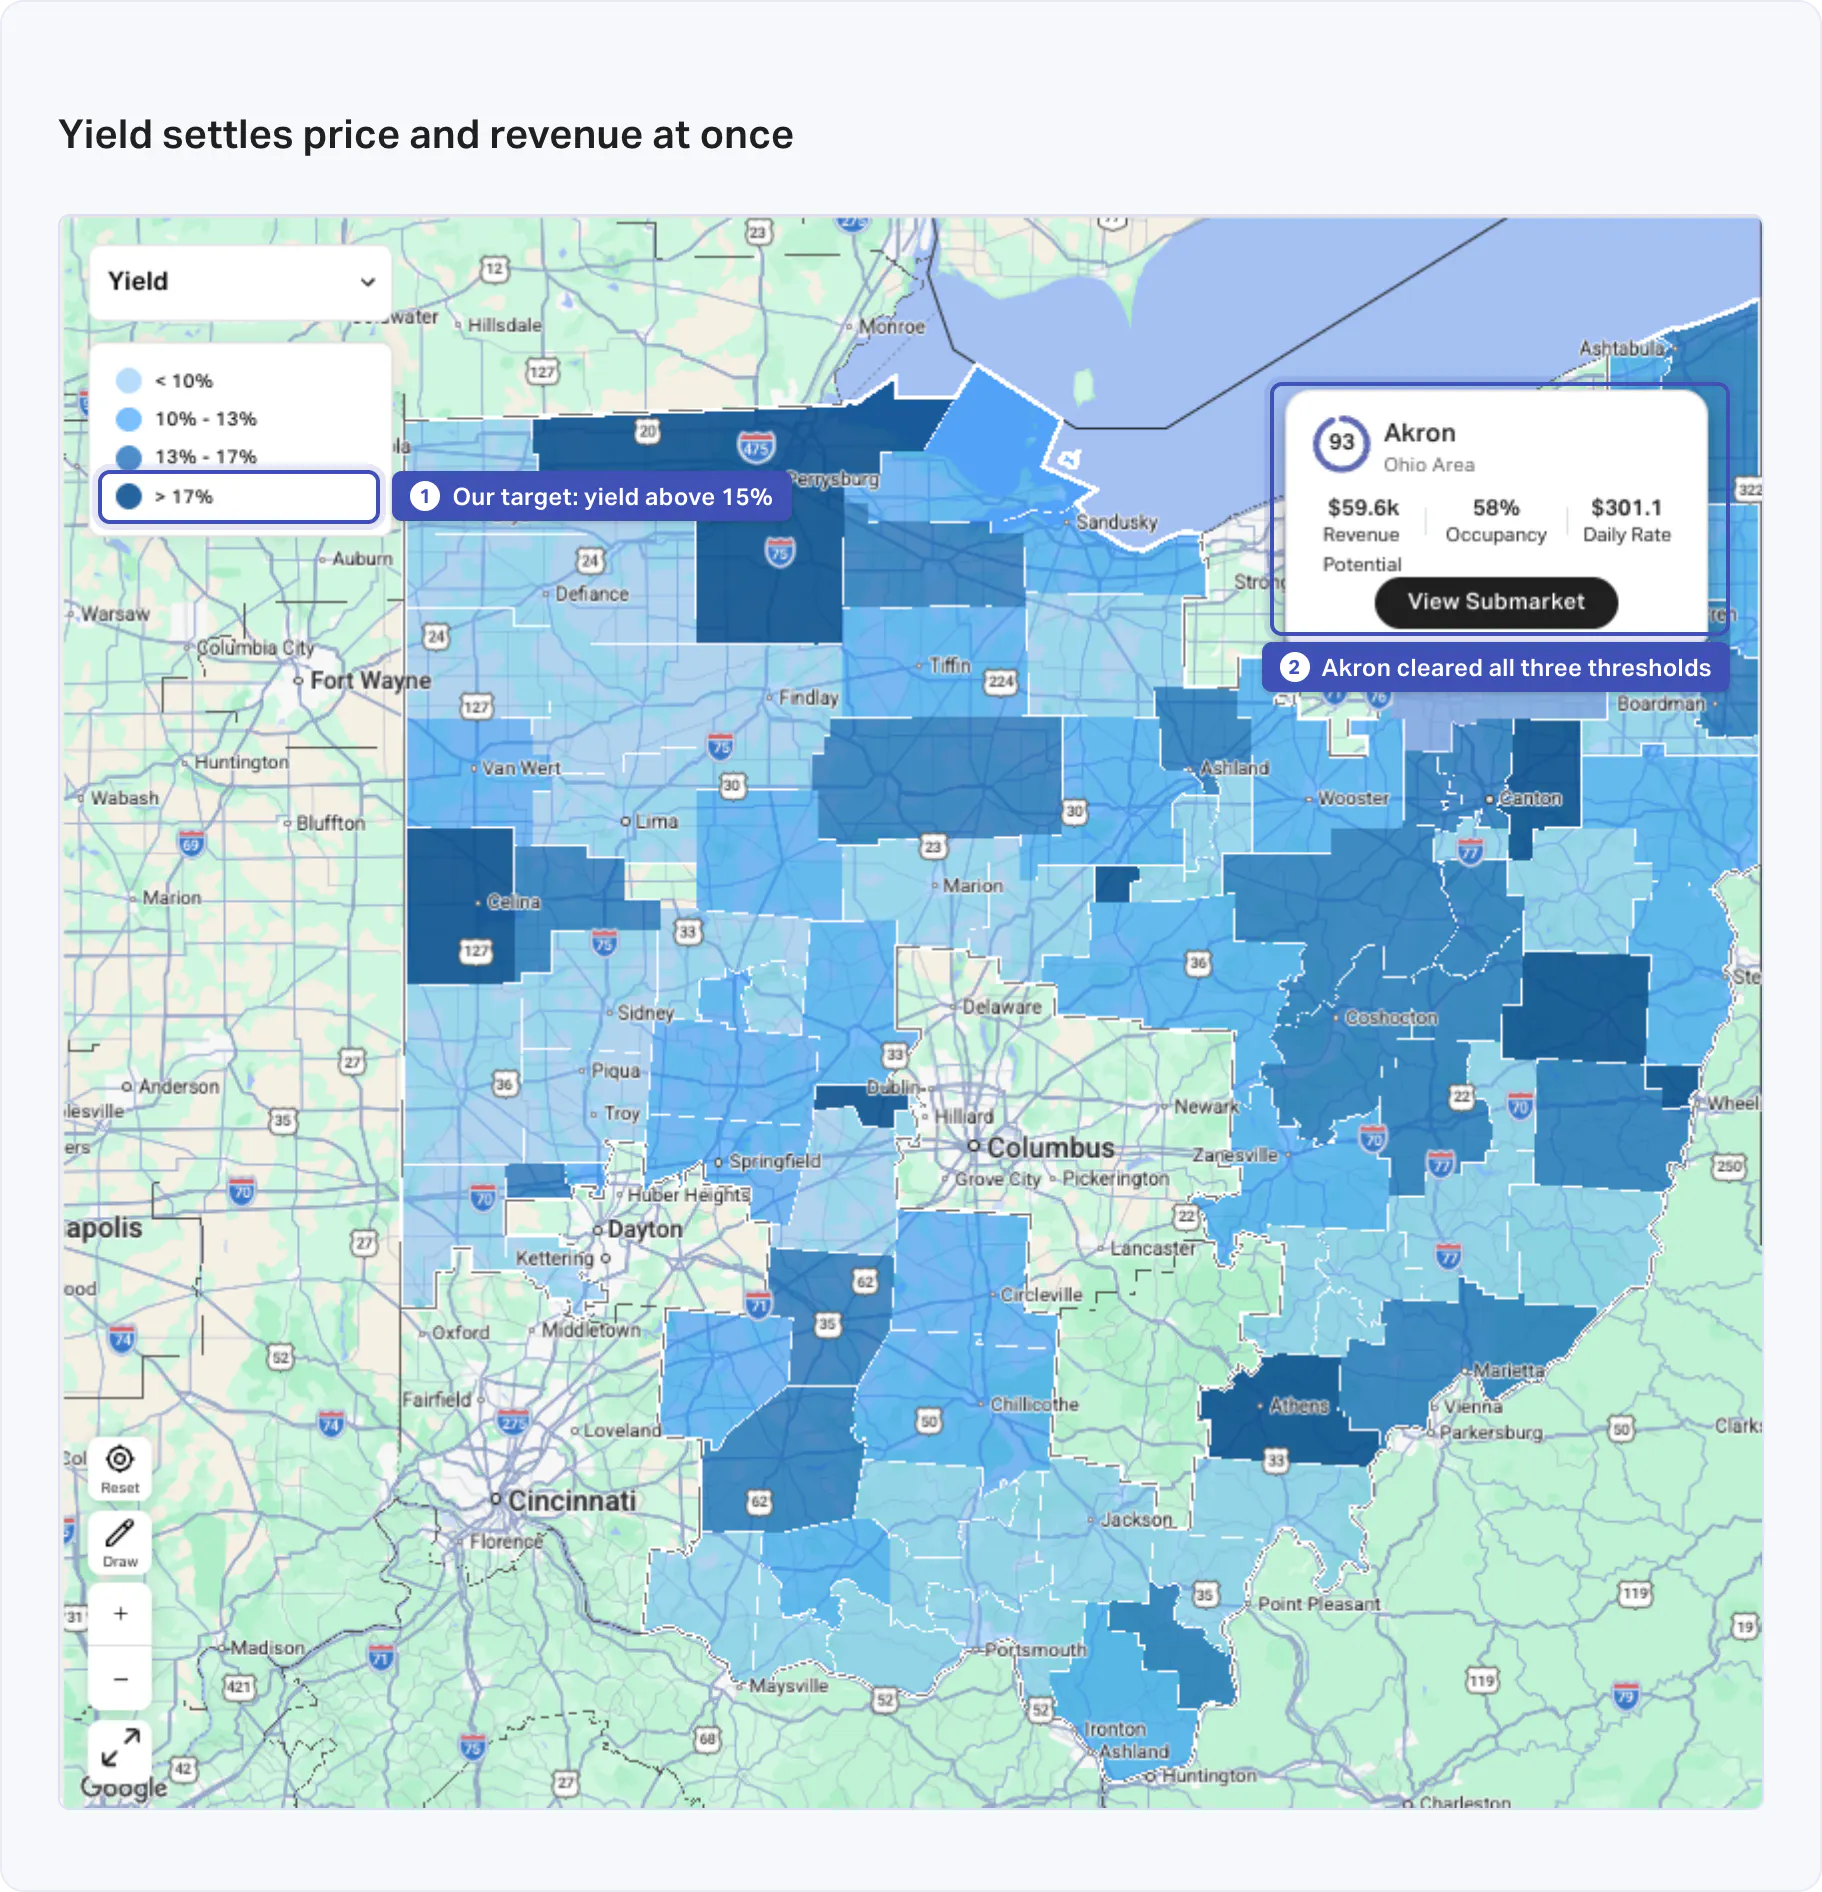
We only added interactive heat maps in the last year, and they make it easier than ever to compare markets, or submarkets, on home price, revenue, occupancy, average daily rate (ADR), yield, and more.
The heat maps respond directly to whatever filters you've applied. If you filter for 4-5 bedroom properties with review scores above 4.5 and over 270 days of availability, that's the performance data the maps will show you. Even the home values will be for 4-5 bedroom properties. For the United States, we have access to every home actively listed on the Multiple Listing Service (MLS), so our home price values reflect the average asking price of properties actually on the market right now.
Home price, yield, and revenue are my favorite heat maps, and they're the three we relied most heavily on. Given a home price of $400K, we needed revenue of at least $60K to see some cash flow. Yield is the ratio of revenue to home price, so we were targeting a yield above 15%. With our filters applied, we looked at markets within driving distance of Columbus to find the ones that cleared all three thresholds. Akron was the most compelling, with homes in our price range and average revenues just short of $60K for 4-5 bedroom properties. We knew $60K was an average, not a ceiling, and our plan was to beat it.
Tip 4: Annual revenue hides seasonality, so check monthly trends
It's tempting to grab a market's annual revenue figure and run with it. But annual numbers completely mask underlying trends.
$60K a year doesn't tell you anything about seasonality, or how that number compares to the previous year. It won't tell you that you might earn the bulk of that revenue over the summer and operate at a deficit through the winter. And it won't tell you revenue was strong this year because the World Cup was in town, and that a normal year is closer to $58K.
AirDNA gives you monthly data going back several years so that you can actually see how performance is trending. We have subpages for supply, revenue, occupancy, ADR, and seasonality that let you see how each metric has trended over the years and across different kinds of properties.
And if some of these metrics aren't familiar to you, you're not alone. ADR, revenue per available rental (RevPAR), occupancy: none of them are obvious the first time you run into them. Every subpage has "Learn" icons next to the KPI figures and charts that explain what each metric means and how to interpret the trend you're looking at.
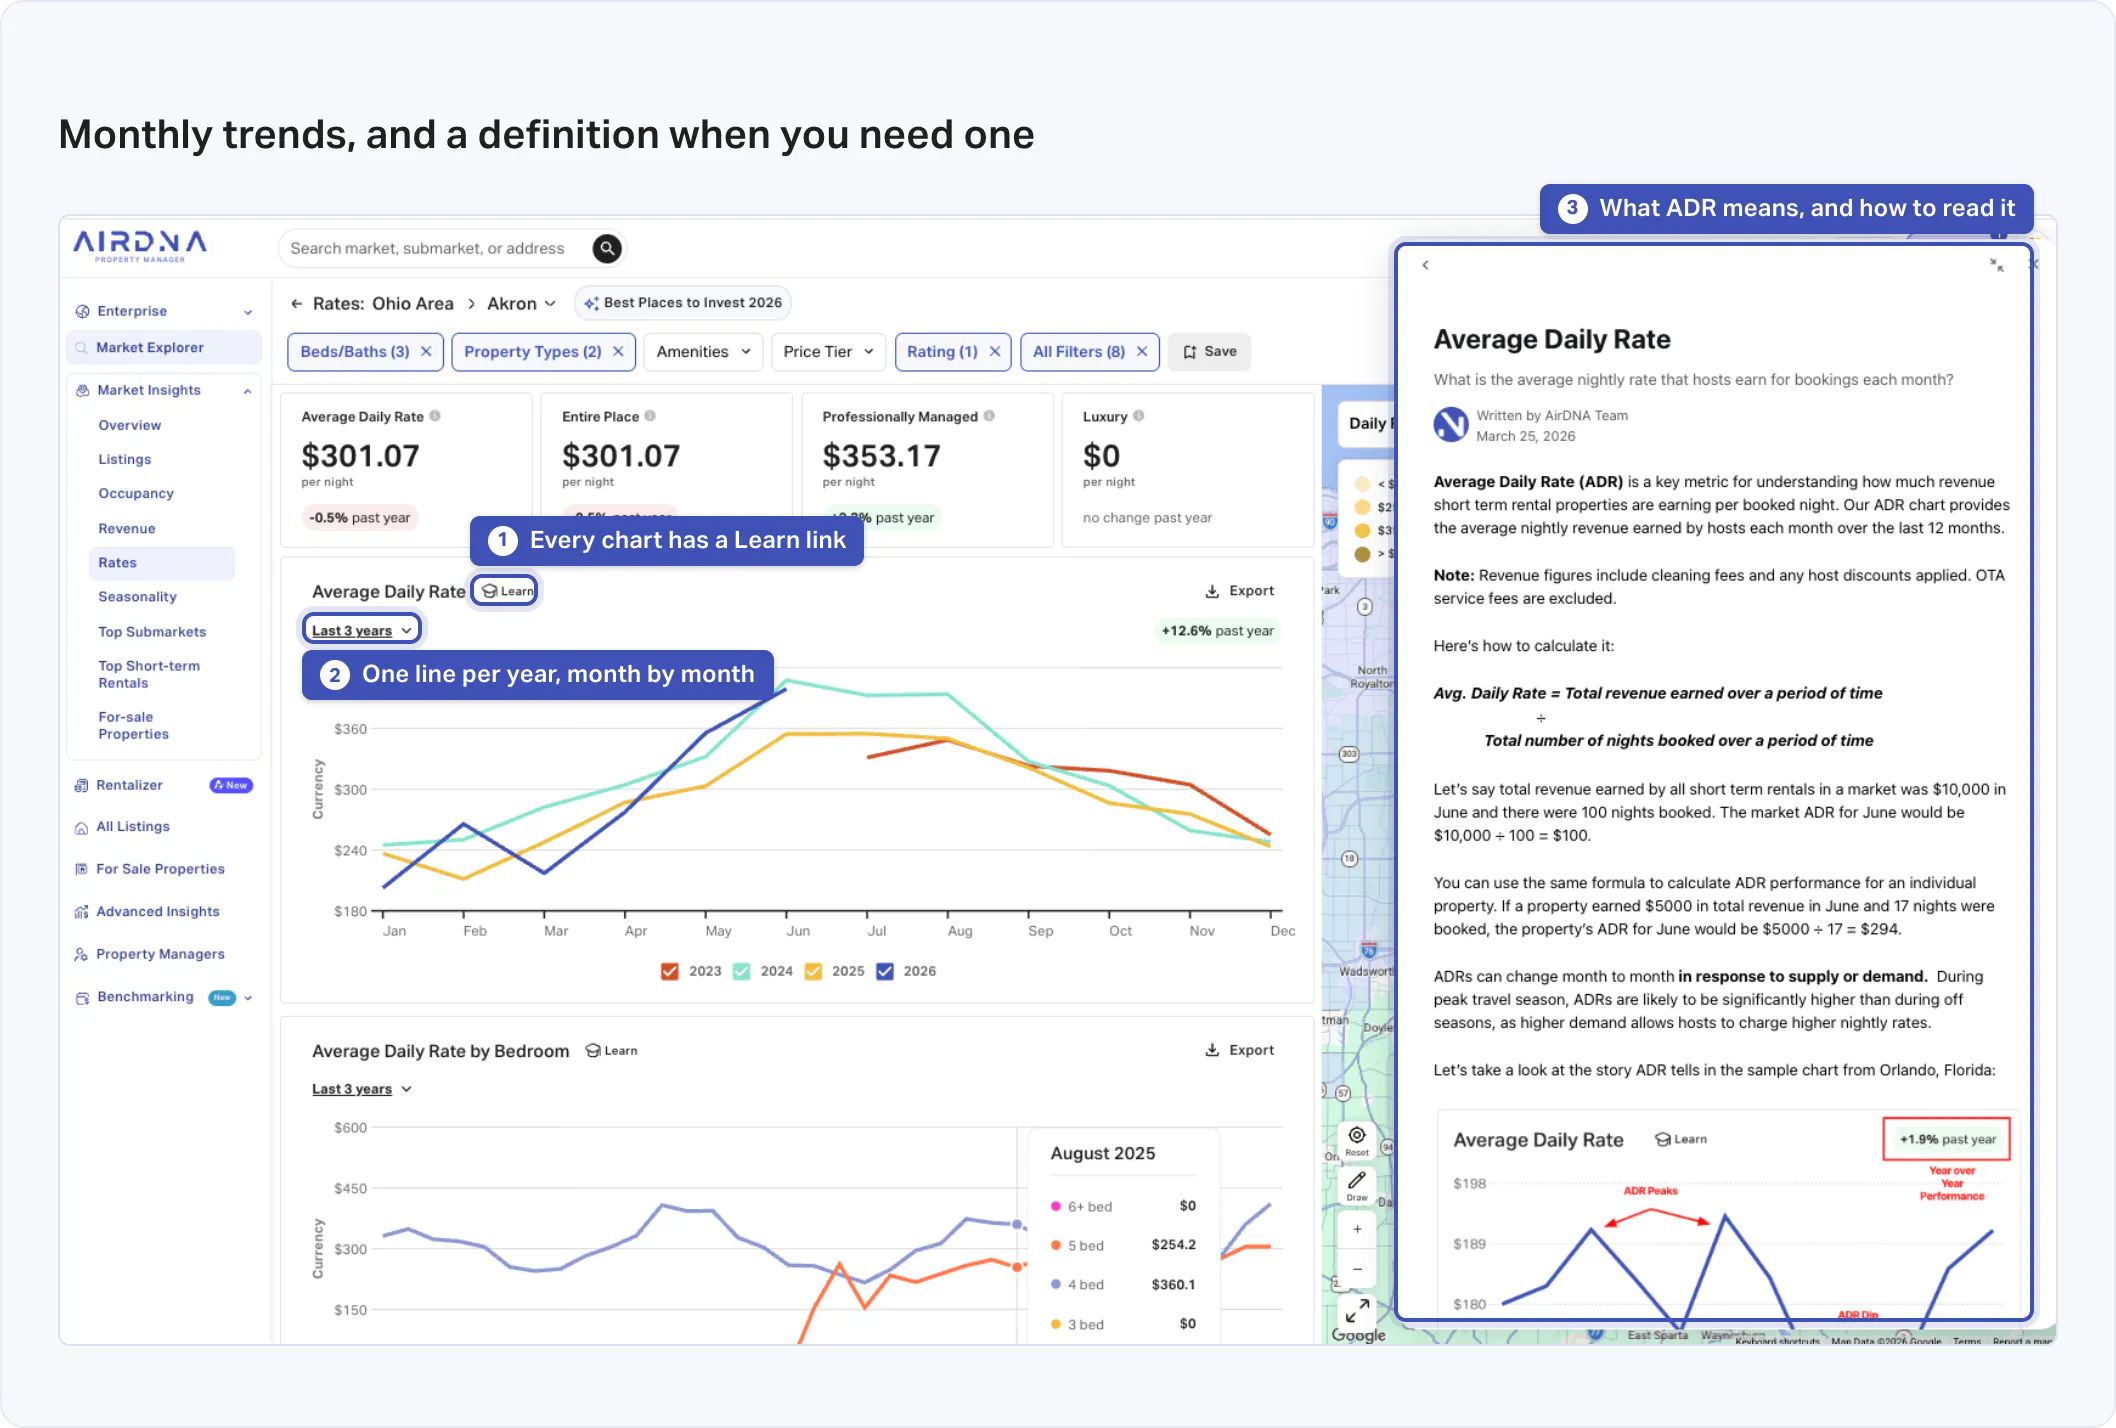
When I was looking at markets we could invest in, it was really important to me that supply and RevPAR were generally trending upward year over year. Supply growth told me investors were still finding profitable opportunities in the market, and RevPAR growth meant that even with more listings competing, hosts were still earning more per available night.
Tip 5: Study the top listings to learn what wins in your market
Once you have a market in mind, it's time to dive into performance at the property level.
Five years ago, you could put a decent house on Airbnb and do fine. That's much less true today, and being a successful rental now requires understanding who your audience is and what they're looking for, then creating a property that meets their needs.
For me, that research started with the listings themselves. Our property-level heat maps let me color code every listing by revenue, occupancy, ADR, review score, and even location score, so the top and bottom performers stood out immediately. From there, I clicked through dozens of them and pored over their photos, amenities, and reviews, all available within AirDNA.
I paid attention to things like:
- How are top properties decorated and furnished?
- What amenities do guests frequently praise or mention are missing?
- What are common complaints guests have?
- What are people saying about the location?
- Are there neighborhoods where high or low location scores cluster together?
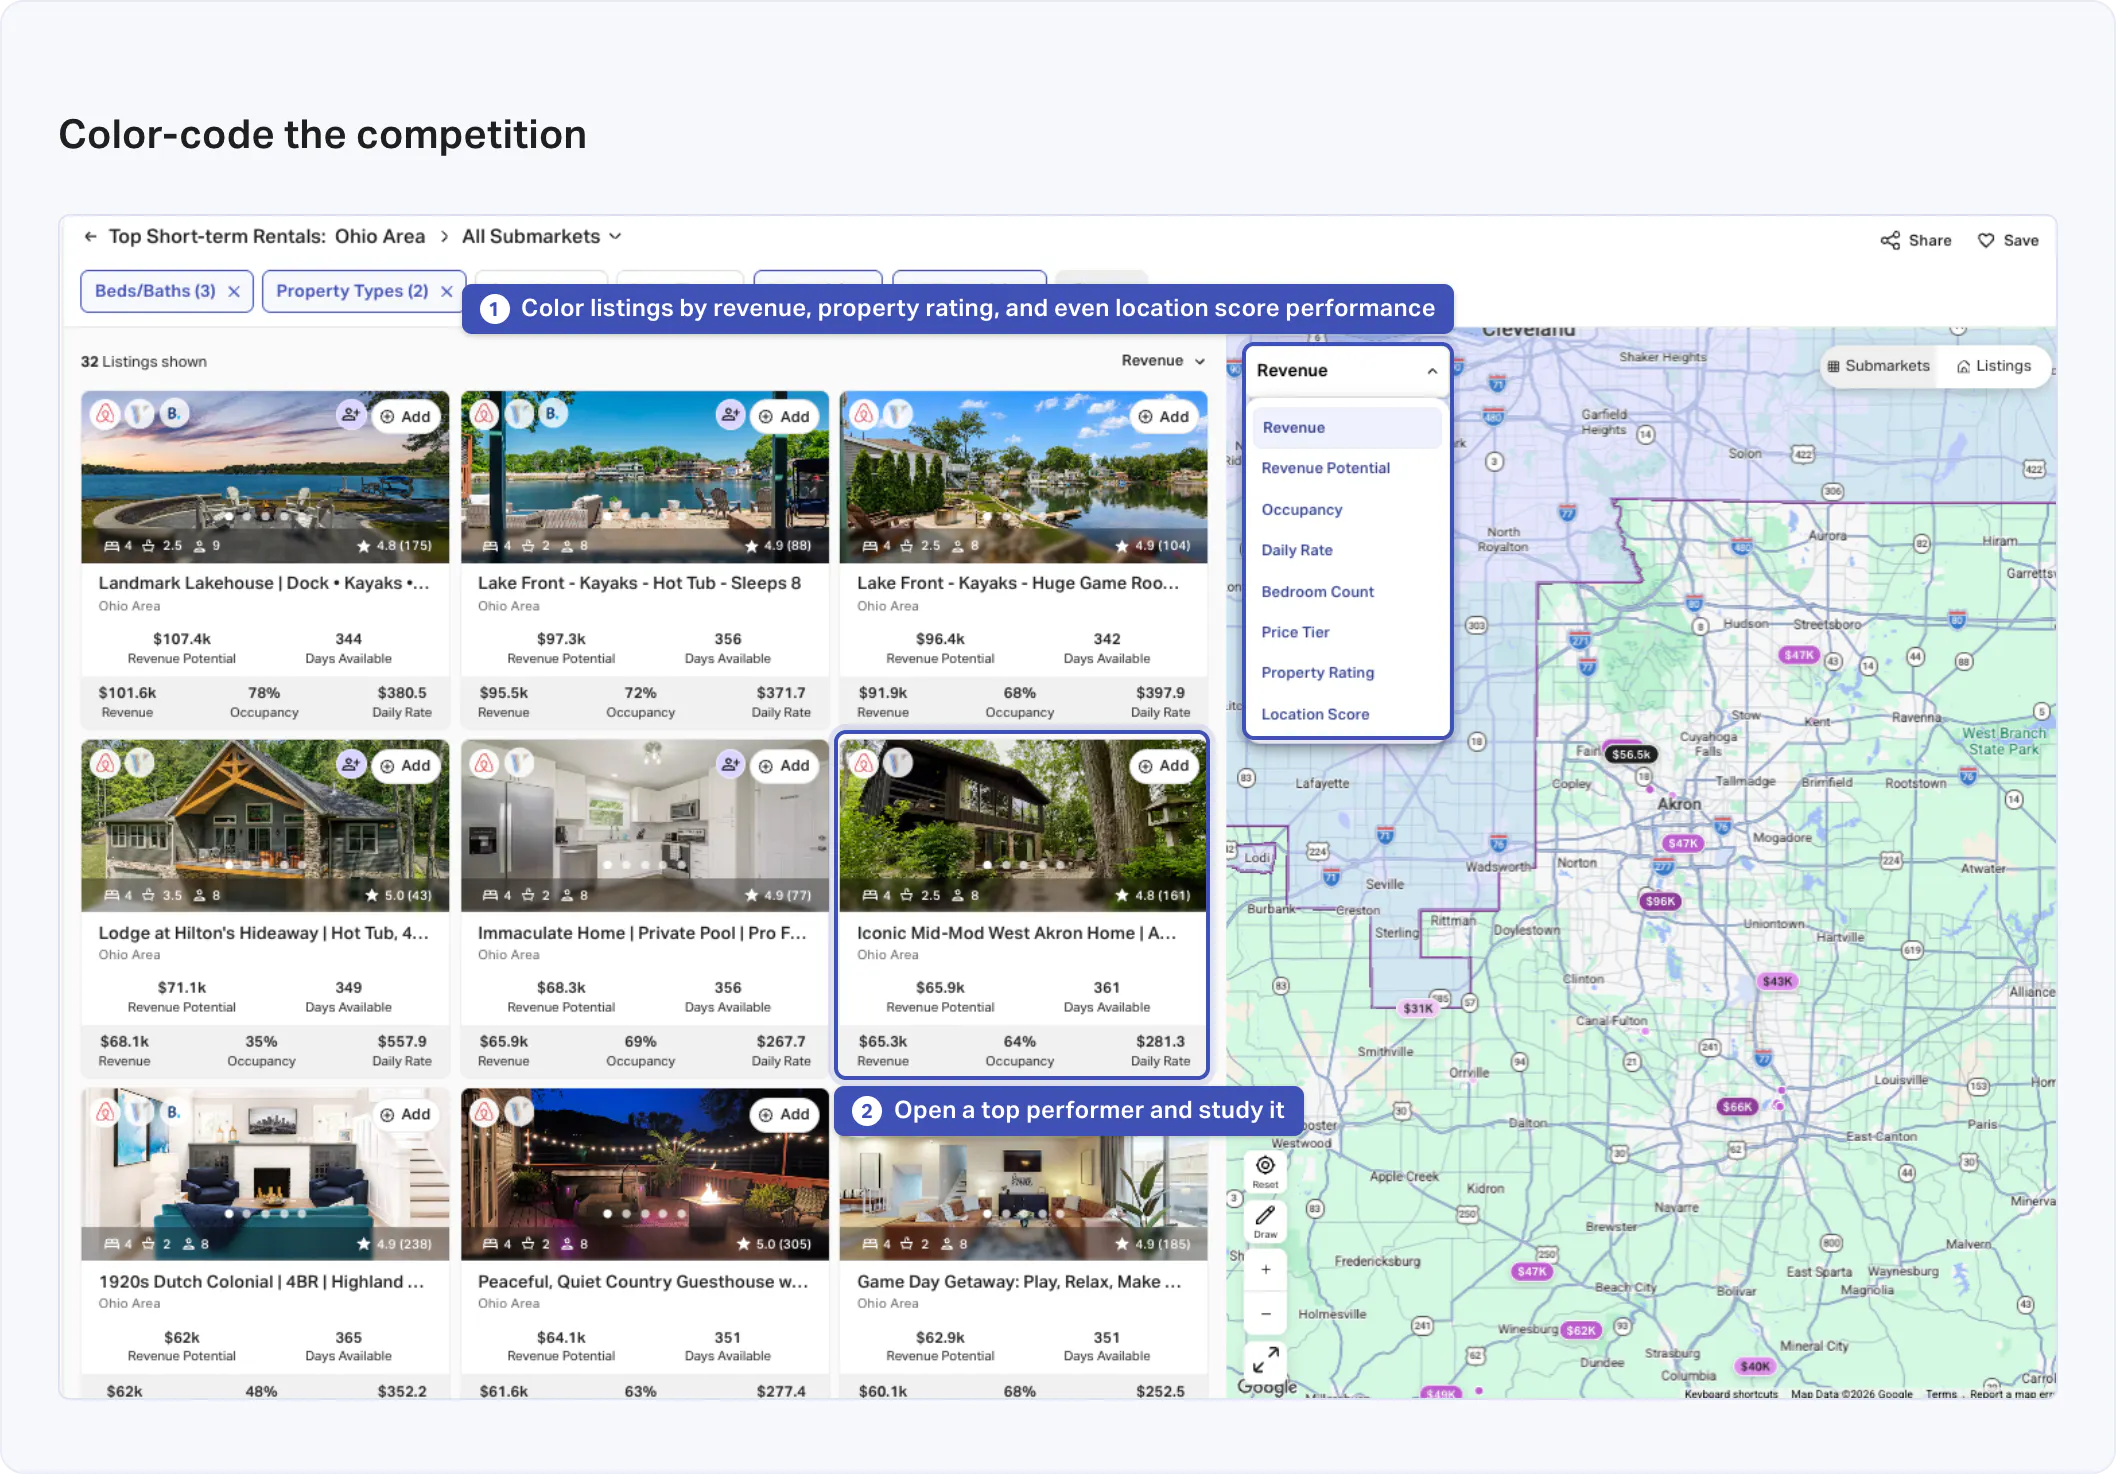
Every listing I clicked through helped me get a better idea of which neighborhoods I'd want to buy in, who my guest avatar would be, and how I could design the place so they'd want to book with me over a competitor. If you're not sure what I mean by guest avatar, or why it matters so much, I wrote a piece on exactly that recently.
We hadn't launched AirDNA AI when I was looking for a property, but this new feature does the bulk of the work for you. At the market or submarket level, it summarizes actual guest reviews, revealing who typical guests are, why they travel to the area, which amenities and property features they value, and what they commonly complain about. At the property level, you get that same information for every listing, including what guests thought of the location.
Instead of spending days reading through reviews, you can understand your guest avatar in an afternoon.

Tip 6: Shop MLS listings by projected yield inside AirDNA
After digging in at the listing level and getting a clear idea of the criteria you're looking for in a property, you'll be ready to start actually shopping.
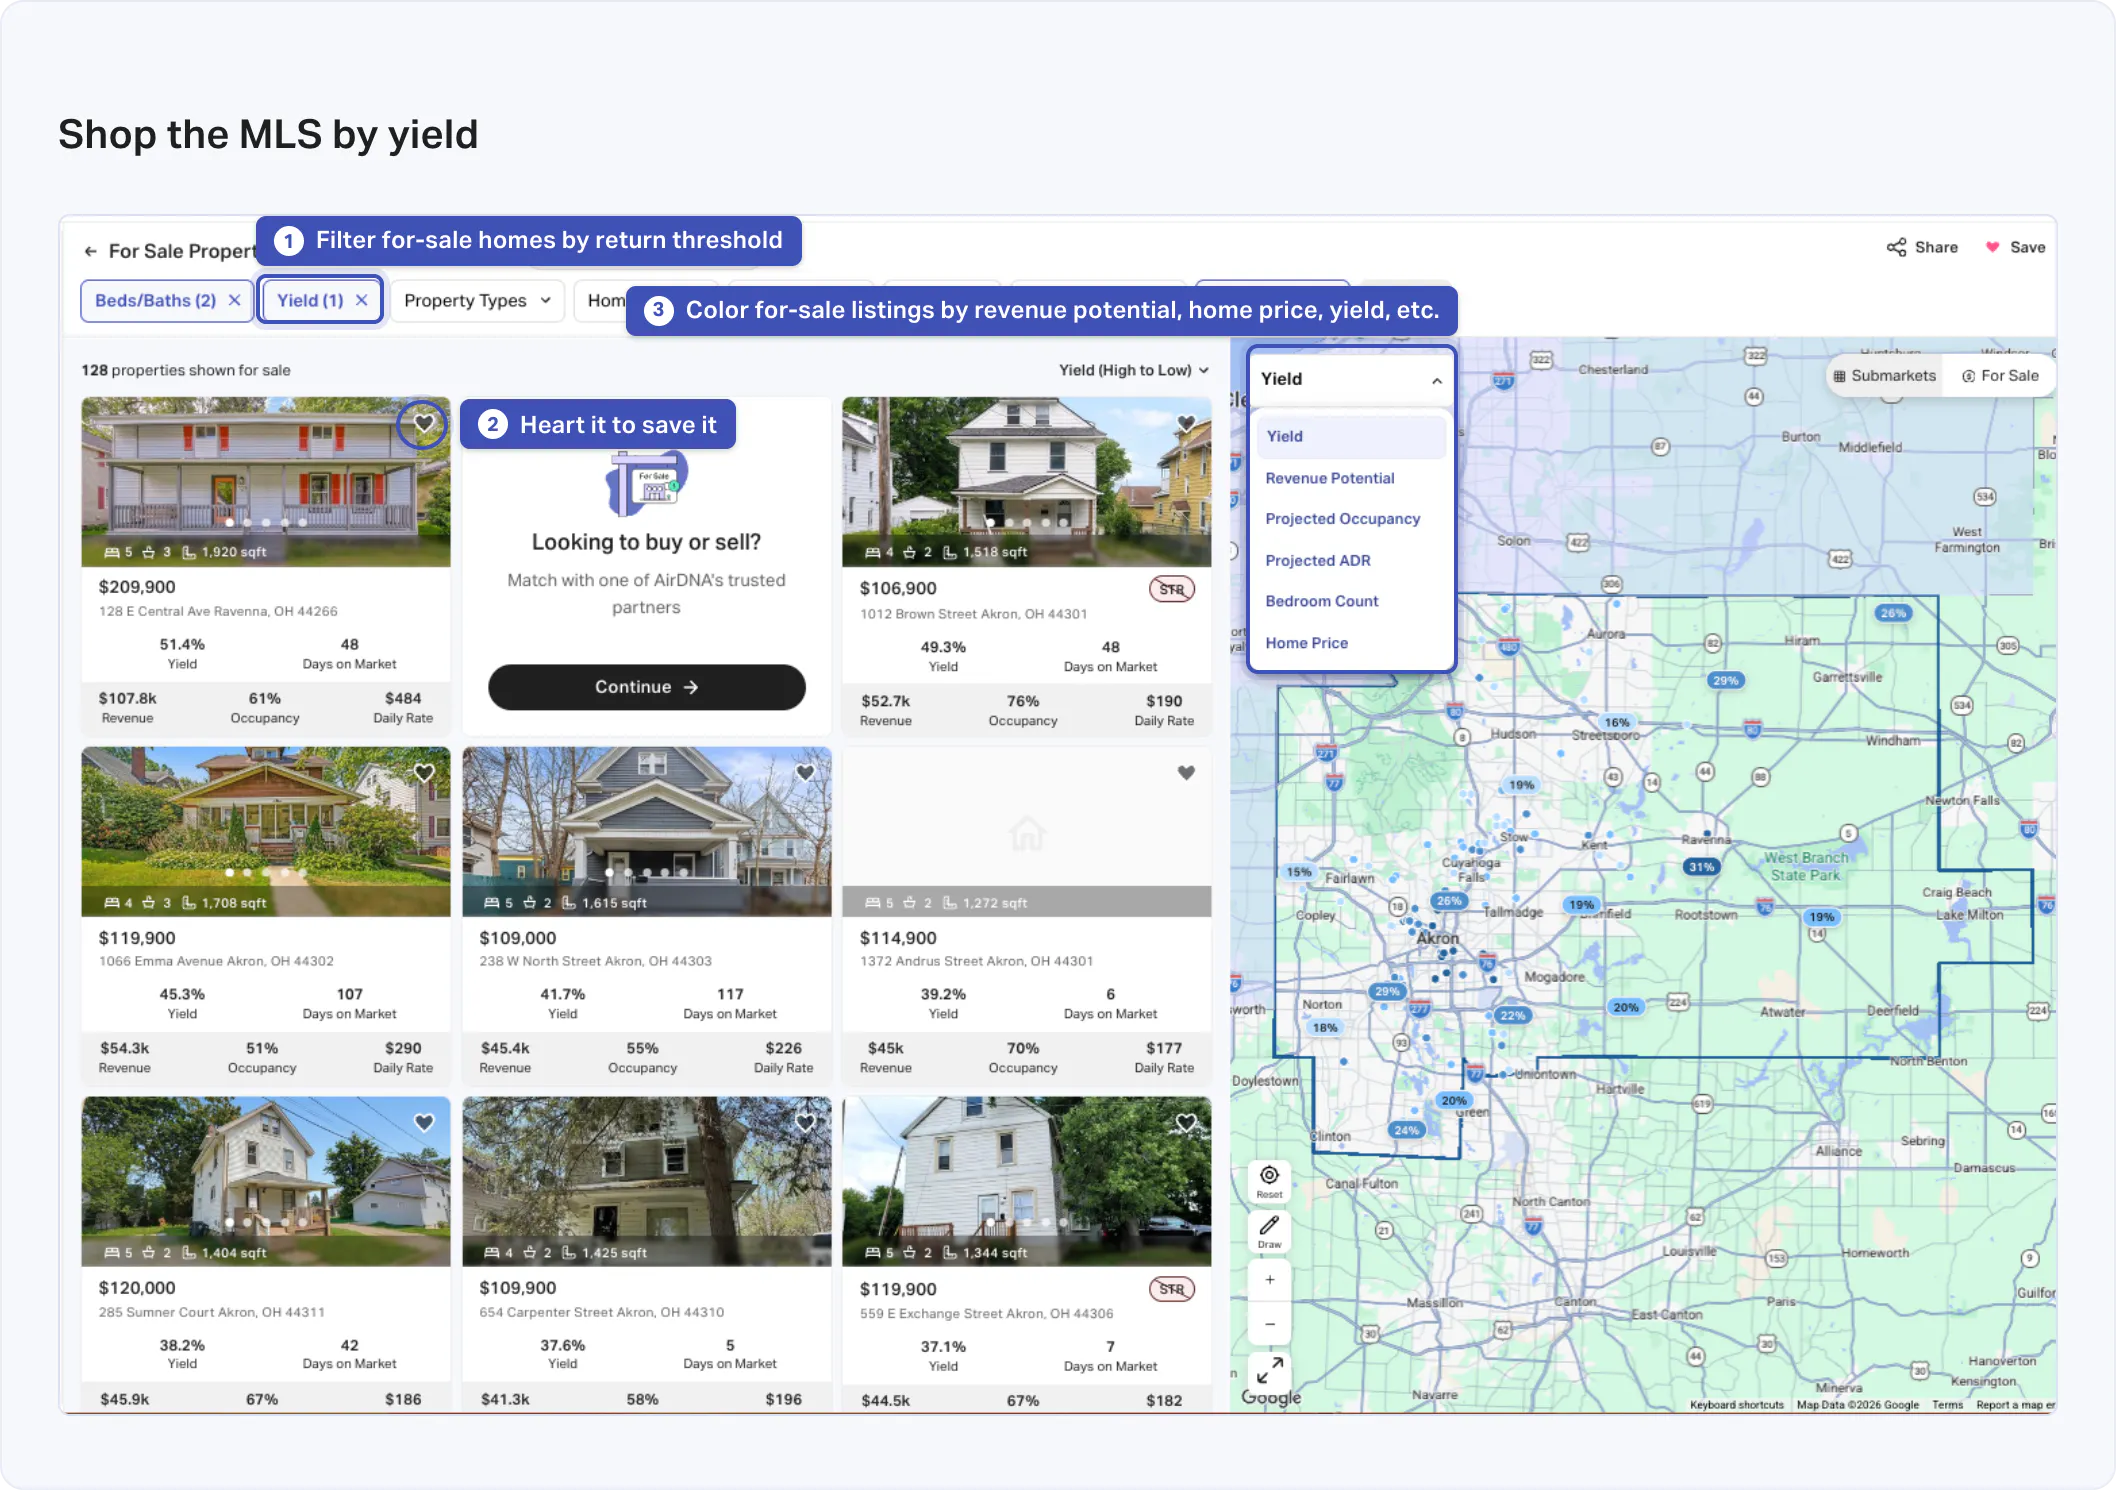
If you're buying in the United States, you can do that directly in AirDNA. We have access to every for-sale property currently listed on the MLS. You can filter by attributes like bedroom count, bathroom count, home price, square footage, and time on market, then save those filters so it's easy to pick your search back up later. You can even filter by yield, so you can quickly get to properties that clear your return threshold.
For sale properties have their own heat map feature too. Color-coding properties by projected ADR, occupancy, revenue, home price, yield, or bedroom count lets you quickly spot the ones that meet your criteria. And when you find one you like, you can click the heart icon to save it.
Tip 7: Your Rentalizer estimate is only as good as your comp set
With a property in mind, you'll be ready to estimate its revenue potential using Rentalizer.
Your Rentalizer revenue projection is only as good as the comps behind it, so it's critical that you choose your comps carefully. A comp, short for comparable, is an existing listing similar enough to your property that its performance is a reasonable stand-in for what yours would earn, and your revenue projection is built from a set of them.
In the past, Rentalizer didn't show you that set, let alone let you change it. Now you can see exactly which listings are driving your revenue estimate, remove any that aren't representative, and use the map and list view of properties to pick closer matches.
What do I mean by representative? Bedroom count and location are obvious characteristics, but the more nuanced details of a property matter just as much.

If the property you're looking at doesn't have room for outdoor amenities like patio seating or a hot tub, then a listing with a great outdoor setup isn't a good comp for you. If the house you're considering needs updating and you don't plan on making many upgrades, don't leave renovated properties in your comp set. And if you're buying a fairly standard 2-bedroom ranch, a one-of-a-kind 2-bedroom A-frame isn't a good comp either, no matter how close on the map it is. Part of what a unique listing is selling is novelty, and you won't be competing for the same bookings. The comps you keep should be the properties you'd realistically lose a booking to.
For Treeside Retreat, I spent a great deal of time refining my comp set. The same filters you use for market research are available in Rentalizer, so I looked for properties with strong review scores, a full year of revenue data, and similar amenities, layout, and features. I got familiar with how every property in my comp set performed on a monthly basis before I trusted what it added up to. Our final annual revenue projection landed at $65K.
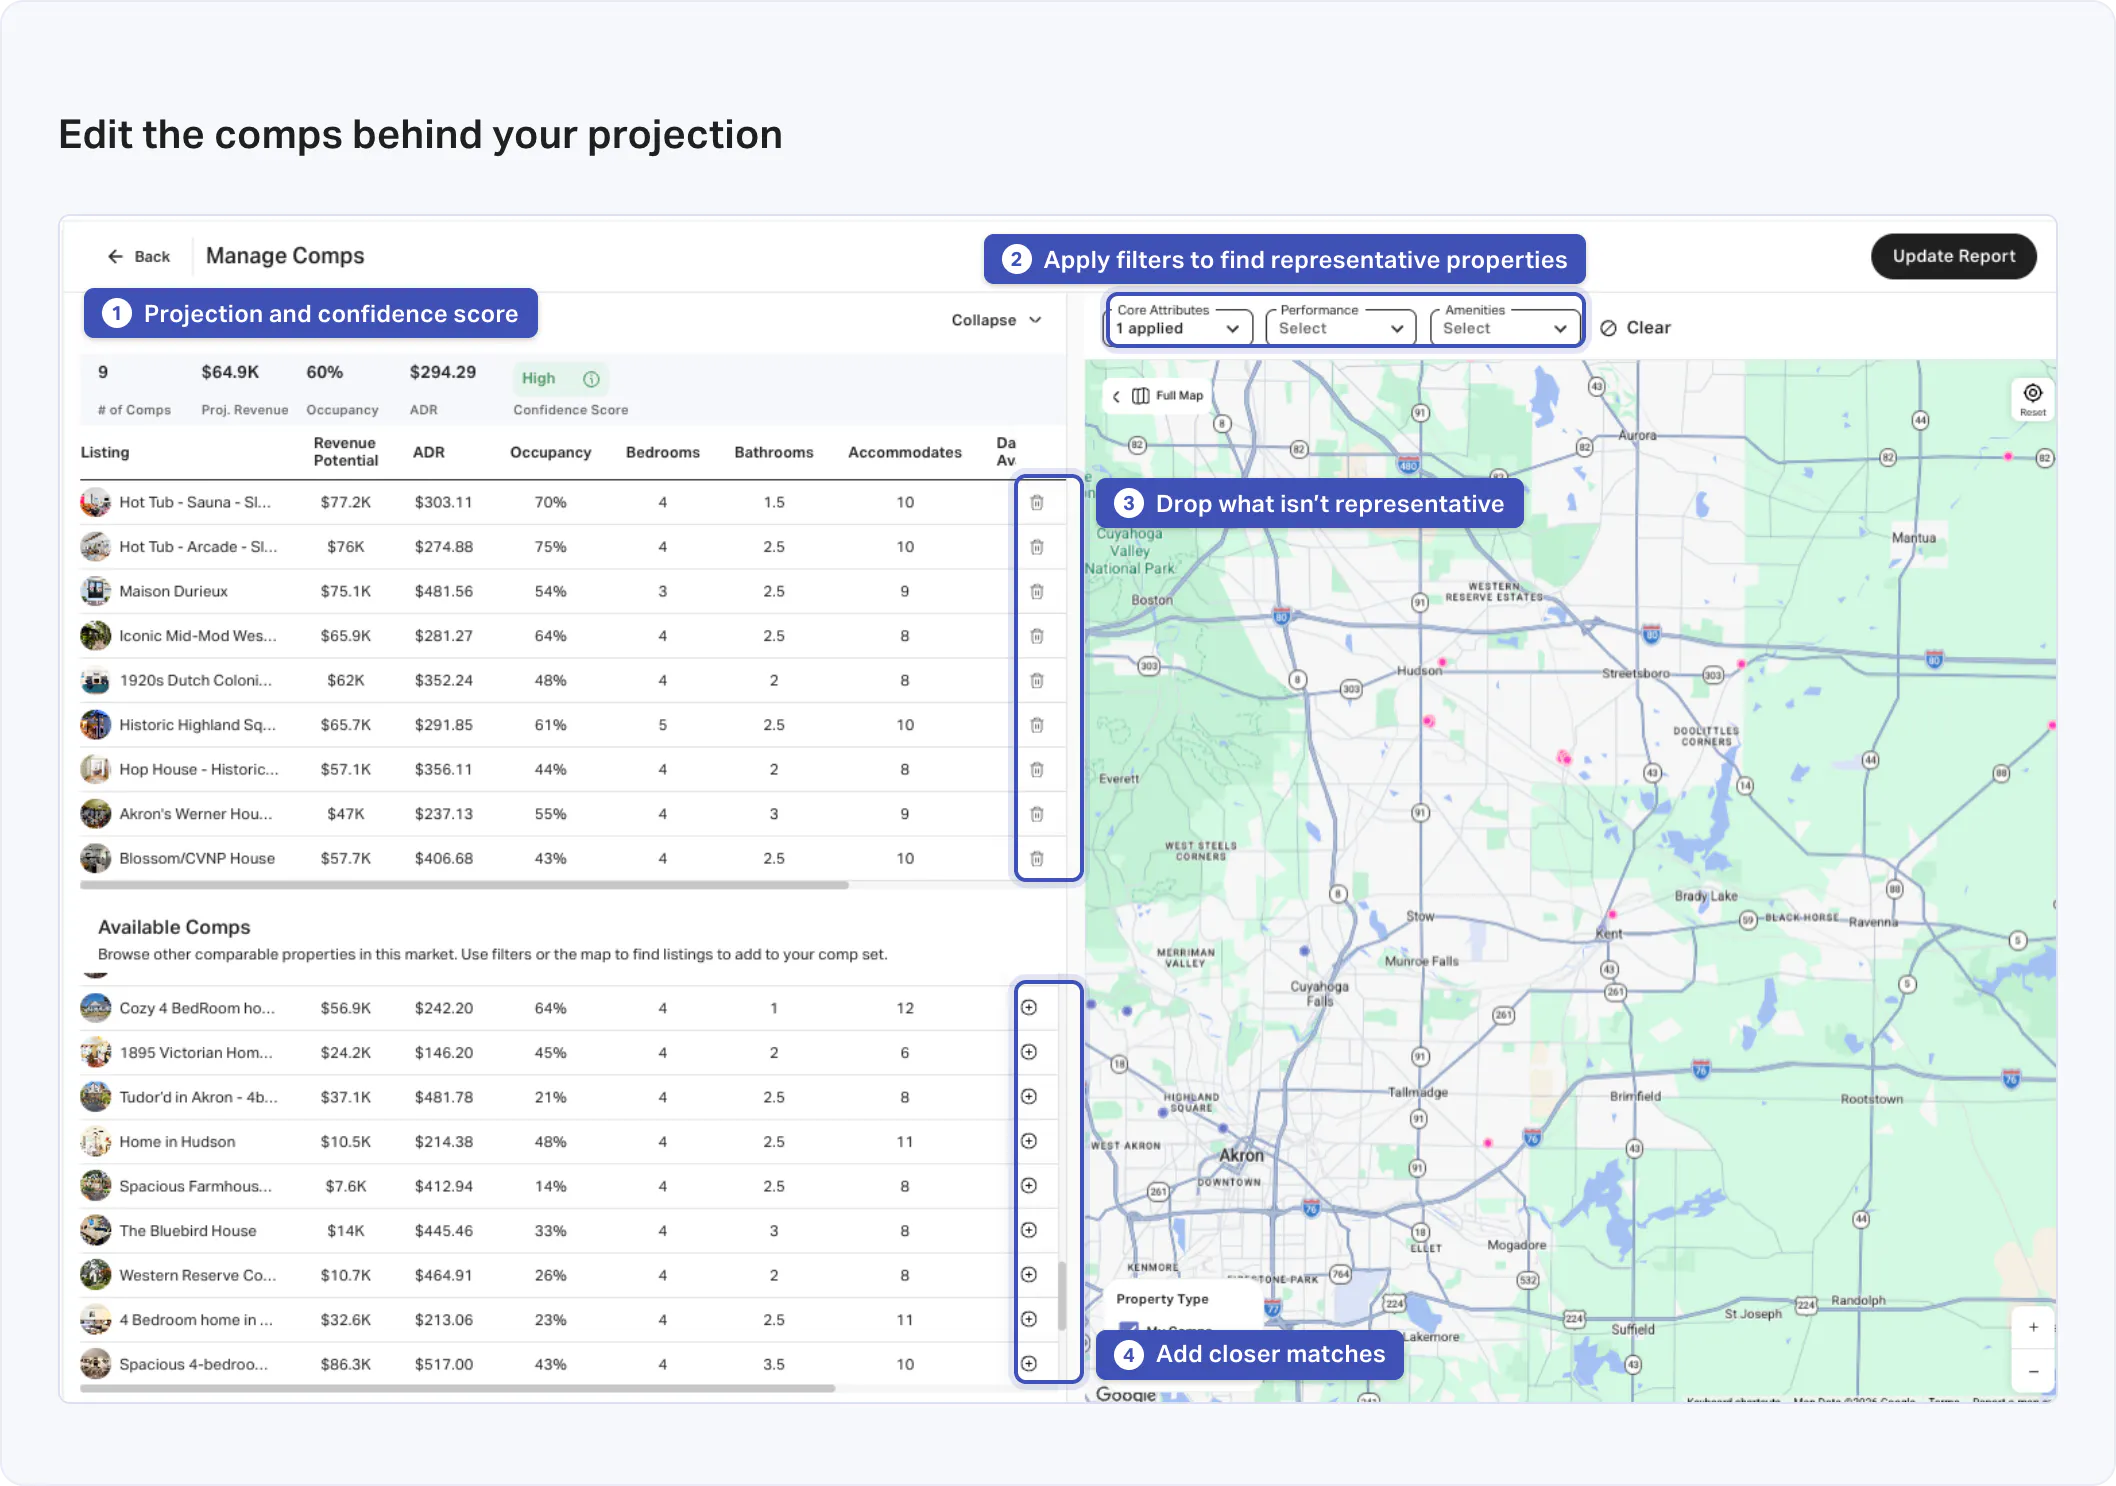
Your projection's accuracy will be heavily dependent on your comp selection, so make sure you put in the time to find representative comps.
Comp selection did just get easier, though. We recently launched Rentalizer Agent, an AI version of Rentalizer that does most of it for you. It starts by pulling property details from public and commercial data sources to build a complete profile of the home you are searching: layout, square footage, year built, architectural style, and key amenities. Then it finds comps based on that entire profile, and every comp comes with a similarity score and an explanation of how it's similar to yours. It also reads hundreds of guest reviews from comparable properties nearby, summarizes seasonality and competitiveness, and researches short-term rental laws and HOA rules for the address.
Estimate any property's revenue
Enter an address and get projected annual revenue, ADR, and occupancy based on real comps nearby.
Tip 8: Check regulations at every level, including the HOA
A property can clear every one of those checks and still be a bad buy if you aren't allowed to operate it.
Be sure to thoroughly research short-term rental regulations in your neighborhood, municipality, county, and state before purchasing your property. Don't skip the HOA on that list. Plenty of HOAs ban short-term rentals outright, and that ban can be in place even where the city and county are perfectly happy to let you operate.
AirDNA does have some regulation data. We flag areas that aren't zoned for STRs, and we've more recently started adding some jurisdiction-level regulation in paid versions of Rentalizer. But notices and flags from AirDNA aren't comprehensive, and regulations change frequently. When you're considering a property, you need to research at all levels yourself.
Rentalizer Agent helps with this part too. When you search an address, it researches short-term rental laws and HOA rules for that specific property alongside the comps, so you walk into your own research already knowing roughly what you are dealing with. I would treat it as a head start, not a substitute for checking the city and the HOA yourself.
And keep in mind that no regulation today doesn't mean no regulation ever. A market that's wide open right now could have an ordinance in front of the city council next quarter, so pay attention to what's being discussed and not just what's on the books. A good way to keep track of that is following local STR forums and city council pages, and getting involved in a local STR alliance.

From research to reality: how my projection held up
I know for me, buying my first short-term rental was nerve-wracking. Even though I had all the data and could analyze it till the cows came home, I was still worried the property wouldn't perform the way I was projecting.
I've been operating for seven months now (since December 2025), and I'm happy to say that so far my property's revenue performance has been stronger than I had projected. We've earned just under $35K in the first six months of this year, about $5K ahead of what we projected we would earn. In that time, we've also garnered over 40 5-star reviews, putting us in the top 1% of Airbnb properties.
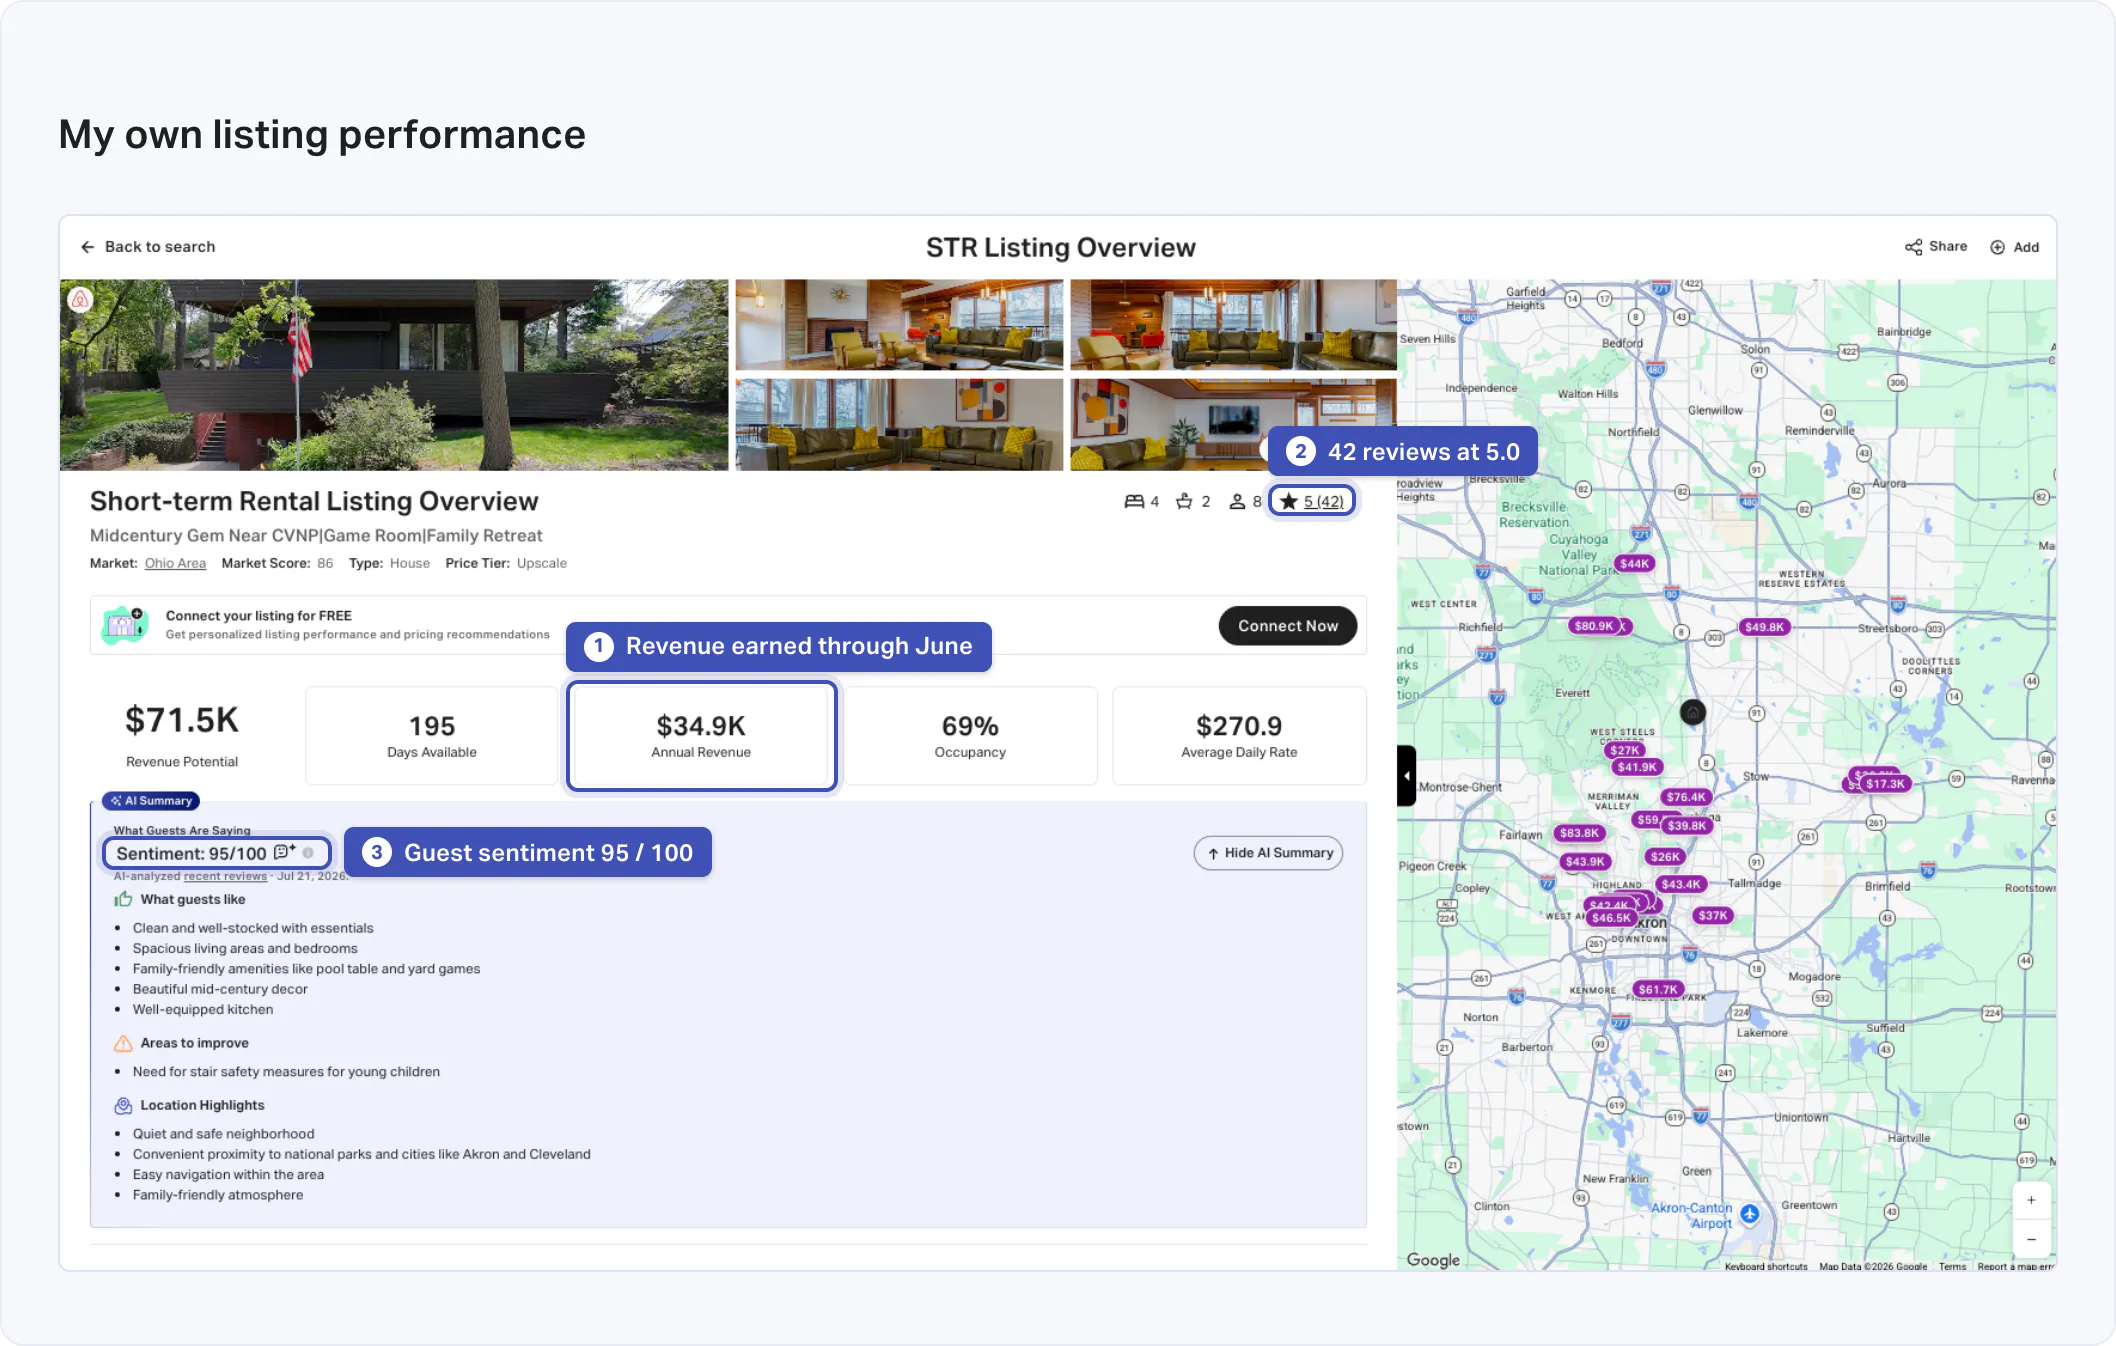
On the revenue side, I attribute our numbers to a comp set I actually trusted. The properties behind that $65K projection genuinely looked like mine, and that's the whole reason it has held up. On the review side, I attribute our success to taking the time to really understand the guests in my market and the qualities of the properties that were doing well. When guests praise our design choices and attention to detail in the home, it really does make all the hours I put into reading reviews of dozens of properties feel worth it.
While all my research helped me feel confident that the market and my property would work, ultimately it was up to me to pull off its operations. Researching and finding a property was just the first part. I found out operations is a whole other ball game that comes with lots of surprises, but that's another story for another day.
However, from reading this blog, I hope you can see that there's a lot that can be known before you even consider buying a property, and it's all available to you in AirDNA.
Cheers and good luck!
FAQs
How do you do market research for Airbnb?
Start with your own constraints, not with the data. Decide your budget, the property type you want, and how far you are willing to drive, then turn those into filters. For us that was a 4+ bedroom home within three hours of Columbus for under $400K. Once your filters are on, use the home price, revenue, and yield heat maps to shortlist markets, then drill into monthly trends and individual listings in the markets that clear your thresholds.
How do you analyze Airbnb data without getting lost in it?
Filter first, then read the trend rather than the headline number. An unfiltered market average includes the 5-bedroom lakefront place and the studio above someone's garage, so it tells you very little about the property you actually want. I filter for review scores above 4.5, at least 10 reviews, and 270+ days of availability, then look at supply and RevPAR year over year to see whether the market is still rewarding new hosts.
Are short-term rentals a good investment?
It depends entirely on the market, the property, and how you run it, so I would not take anyone's blanket yes or no, including mine. What I can tell you is what the numbers have to clear. We needed a yield above 15% and revenue of at least $60K on a $400K home to see cash flow. Run those thresholds against real market data before you fall in love with a house.
How do you invest in short-term rentals step by step?
Pick the market before the property. Narrow to markets that clear your revenue and yield thresholds, study the top-performing listings there to understand who the guests are and what they expect, then estimate a specific address with Rentalizer and rebuild the comp set by hand. Last, check regulations at the neighborhood, city, county, and state level, and do not skip the HOA.
Do I need a paid AirDNA subscription to do this?
Some of it. There is a free tier that will let you look around, but most of what I describe here, including global market access, the filters, the property-level heat maps, and comp editing in Rentalizer, needs a Pro subscription. The data I used as an analyst is the same data a Pro subscriber gets.
ARTICLE SUMMARY
AirDNA Senior Research Analyst Linda Rollins shows how to use AirDNA to research a short-term rental investment: the filters, heat maps, and yield thresholds she used to pick her market, and how she rebuilt her Rentalizer comp set before buying.
Linda Rollins
Senior Research Analyst
Linda Rollins is a Senior Research Analyst at AirDNA and a self-managing short-term rental host, which means she understands the market as both an analyst and an operator. She writes research and blogs for AirDNA and for Adapt, its revenue management tool, making her work a go-to resource for investors trying to find and size up the right opportunities, and for operators looking to understand changing market dynamics and find concrete ways to improve occupancy, rates, and guest experience. Her data is regularly cited in major news outlets, and she has a knack for bringing both the numbers and the story behind them. In her free time, Linda enjoys spending time with her family, traveling, and looking for good eats.
