

 Calculate Revenue
 Research Markets
 Find For Sale Properties
 Compare My Listing
 STR Revenue Calculator
 Custom Comp Sets
 Submarket Insights
 Custom Search Filters
 Rate Recommendations
 Performance Benchmarking
 Competitor Comparison
 Owner Contact Details
 Property-level performance data
 Tourism Insights
 Real Estate Investment Analytics
 About Us
 Sales
Sales Support
 Press
PressBest Places to Invest
in Short-Term Rentals
in 2026

2026 is shaping up to be one of the most investor-friendly years in recent memory. We've compiled the best places to invest in short-term rentals right now so you can capitalize on the opportunity.
Looking for a teaser on the best Airbnb markets before you dive in?
2026 is shaping up to be one of the most investor-friendly years in recent memory. We've compiled the best places to invest in short-term rentals right now so you can capitalize on the opportunity.
Looking for a teaser on the best Airbnb markets before you dive in?
2026 Outlook
Short-term rental investing in 2026 is projected to be more accessible than it’s been in years. Financing has improved, margins are healthier, and 2027 performance forecasts spell demand and occupancy recovery after a prolonged slowdown. After a few tough years, the math is working, and in more markets.
The biggest shift? Mortgage rates. After hovering near 7% in early January 2025, they’ve dropped to around 6.1% and are expected to stay there. That doesn’t make every property a deal, but it does lower the bar for what counts as a viable investment.
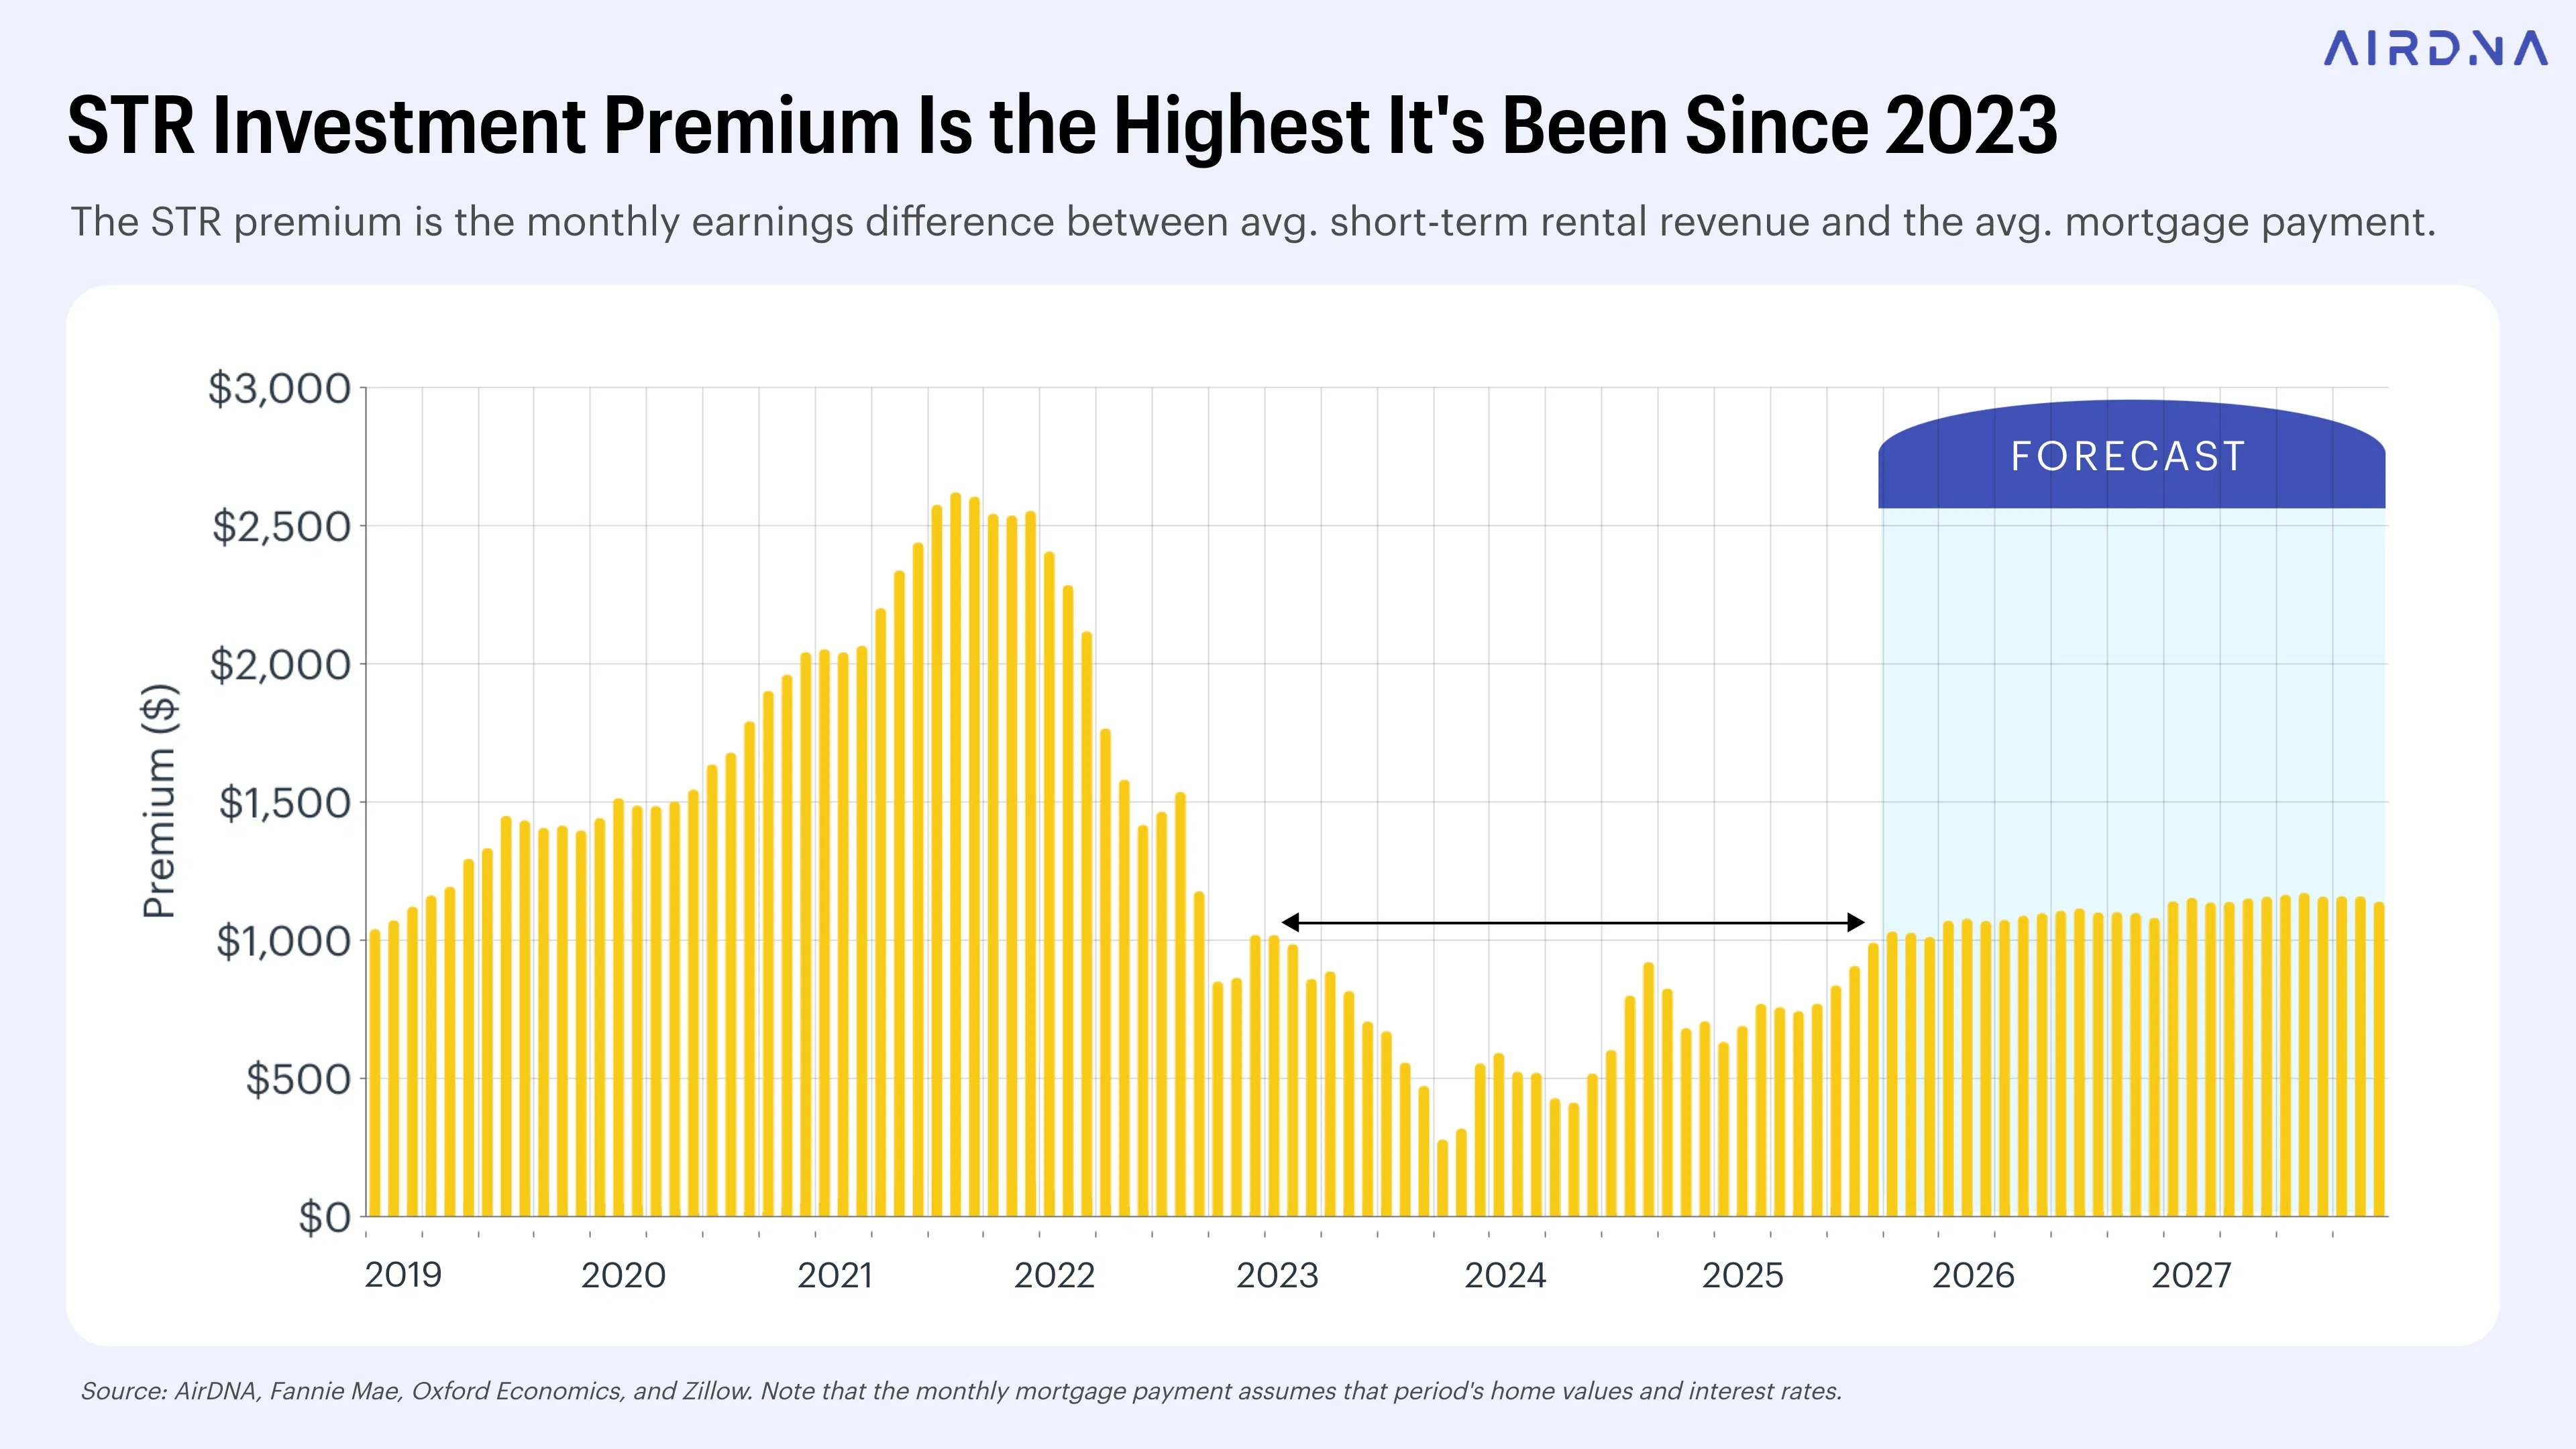
We’re seeing that reflected in the STR premium: the difference between what a typical short-term rental earns in a month and what it costs to finance. As of early 2026, that premium sits at $989, the highest level since late 2022 and nearly three times higher than it was at the low point in October 2023. That kind of cushion makes a big difference, especially for investors trying to lock in better cash flow from day one. We talk about this in more detail in the 2026 U.S. Outlook report.
At the market level, the numbers are equally compelling. The average home price across our Top 10 Best Places to Invest is approximately $296,000, a more accessible entry point than many traditional vacation markets. Most of these top Airbnb markets are in small and mid-sized cities, where price points are approachable, and competition tends to be lighter. This aligns with the results of our latest investor survey where 60% investors indicated they were looking to send less than $100k of capital (down payment + setup costs, + reserves) on their first investment.
Returns on investment are solid too. These markets average about $40.5K in annual revenue potential and post an average yield of 13.7%. Even the lowest among the group comes in at 11.9%, while some go north of 16%.
On the performance side, 2026 is actually expected to be a year of slower growth. Contrary to what you might think, that’s not always a bad thing. Demand, occupancy, and ADR are all projected to rise, but gradually. For investors, that means fewer bidding wars, more motivated sellers, and more time to focus on buying well, not just fast. Strategic investing will pay off in 2027 when performance begins to rebound.
While the odds are definitely in your favor, the right opportunity still depends on your situation. Vacation rental markets can look great on paper, but if they’re priced out of reach or don’t align with your strategy, they’re not the right fit.
That’s why we’ve expanded this year’s report with a few new ways to narrow the field. In addition to the overall rankings, you’ll now find breakout lists designed to help you filter by purchasing budget or by what’s driving demand in a given market, whether that’s a national park, a ski resort, or a major university.
2026 is offering short-term rental investors something they haven’t had in a while: options. BPTI is built to help you make the most of them.
Invest smarter with the metrics that matter.
The numbers don't lie. Discover markets that are really worth your investment, based on real properties that are for-sale today.
Methodology
The Best Places to Invest report is built to answer one key question: Where can you buy a short-term rental property today that’s likely to perform well tomorrow?
To figure that out, we focused on property listings that are actually for sale right now, not just overall market trends. For every market we consider, we look at homes currently on the market and estimate how much short-rental income each one could generate. These data-backed estimates are based on local booking patterns, pricing, and seasonal demand for comparable active vacation rentals in the area.
Then, we compared that potential income to the property’s list price to get a sense of how strong the return could be.
That last step matters. A market might have great STR performance on paper, but revenue potential means little if there are no properties available for purchase or if all the properties that do exist are priced too high to deliver a decent return. By starting with real, for-sale inventory, we’re identifying markets where the numbers work and there are actually investment-ready homes to choose from.
Some of the markets on our list might surprise you because they’re not stereotypical vacation destinations. In some of the best cities for airbnb investment in 2026, demand isn’t coming from leisure travelers. Rather, a transient workforce, medical tourism, and government or military-related visitation is driving Airbnb bookings. The relatively small role played by traditional tourism is part of what makes these markets cost-effective to invest in. They fly under the radar of short-term rental investors, which means reasonable home prices and limited competition if you get in early.
It all comes down to the data, not whether you can imagine someone vacationing there. Each market is scored using AirDNA’s Best Places to Invest (BPTI) Score, a metric built to highlight places with strong demand, growing revenue, and properties that offer good value relative to income potential.
Three key metrics
Demand reflects how often rentals are booked and whether travel interest in the market is growing. It includes:
Trailing 12-Month (TTM) Occupancy Rate: This measures the percentage of available nights that rentals were booked over the past year. For instance, a TTM occupancy rate of 70% means that 70% of all available listing nights were rented.
Booked Listing Growth: This tracks how the number of rented properties has increased over time, offering insight into market expansion.
Together, these metrics capture the popularity of a market and whether demand is on the rise.
We take into account revenue growth, which indicates whether properties in a market are becoming more profitable over time. We track year-over-year changes in Revenue Per Available Rental (RevPAR) for properties booked over the past two years to assess revenue growth. RevPAR is your Average Daily Rate (ADR) multiplied by your occupancy rate. It's a crucial indicator of market profitability because it reflects both pricing power and booking frequency, offering a clear picture of how well properties in a market are performing.
Investability evaluates the strength of current opportunities by focusing on properties that are actively for sale. We calculate gross yield—a key metric for investors—by dividing a property’s annual revenue potential by its sale price. We’ve aggregated yields at the market level to identify locations where there are real opportunities to secure high-performing investments right now.
What’s New in 2026
While our Top 10 are still ranked by BPTI Score, this year’s report also includes new breakout rankings based on two key investment factors:
- Purchasing budget: Markets are grouped by average home prices, from under $100K to over $5M, so you can focus on options that fit your buying power.
- Demand driver: What consistently brings guests to the area, like beaches, ski resorts, national parks, universities, or wineries. These features shape when people book, how often they return, and what kind of guest demand a market supports.
The breakout rankings are ranked by yield rather than BPTI Score for ease of comparison. It’s a simple way to see where your money is likely to stretch further and work harder.
These new breakouts are here to help you find markets that make sense in the real world for your investment goals.
What about regulations?
Regulations weren’t included in the calculation of BPTI Scores this year, but they played an important role in our overall methodology. Locations with strict policies—such as those requiring rentals to be primary residences or mandating hosts to be on-site—were excluded to ensure the list reflects markets with viable opportunities for short-term rental investors.
For the markets included in this report, we’ve included a high-level overview of the regulatory environment and highlighted any particularly stringent or complex regulations in the individual market write-ups. These may include permit requirements, zoning restrictions, or short-term rental taxes. Some markets require hosts to collect transient occupancy taxes, obtain specific business licenses, or adhere to zoning rules that make parts of the area off-limits to short-term rental operators—all of which can affect operational costs and profitability.
If you’re interested in a specific market, it’s crucial to research local short-term rental regulations. This process can take time, as the information isn’t always easy to find or centrally located. It often requires searching through local ordinances or city websites.
While we’ve focused in this report on the regulations that are most relevant to investors, we’ve also put together a guide to help you find short-term rental ordinances in your area. Taking the time to understand these rules helps you make informed decisions and avoid surprises as you plan your investment.
BPTI Score vs. Market Score
If you’ve used AirDNA before, you’re probably familiar with the 0-100 Market Score that contextualizes performance information for every market and submarket in our database. As similar as they may seem, the BPTI score is NOT the same as the Market Score.
While both are AirDNA metrics designed to evaluate STR markets, they’re calculated differently and serve distinct purposes. Understanding these differences will help you get the most out of this report and confidently use it to guide your next investment decision.
The BPTI Score is designed to identify current investment opportunities by focusing on properties actively for sale. It’s ideal for investors ready to take action now.
In contrast, the Market Score offers a broader snapshot of market health, incorporating additional factors like seasonality and regulation to provide a longer-term perspective that serves both investors and existing hosts.
Best Places to Invest Based on Your Budget


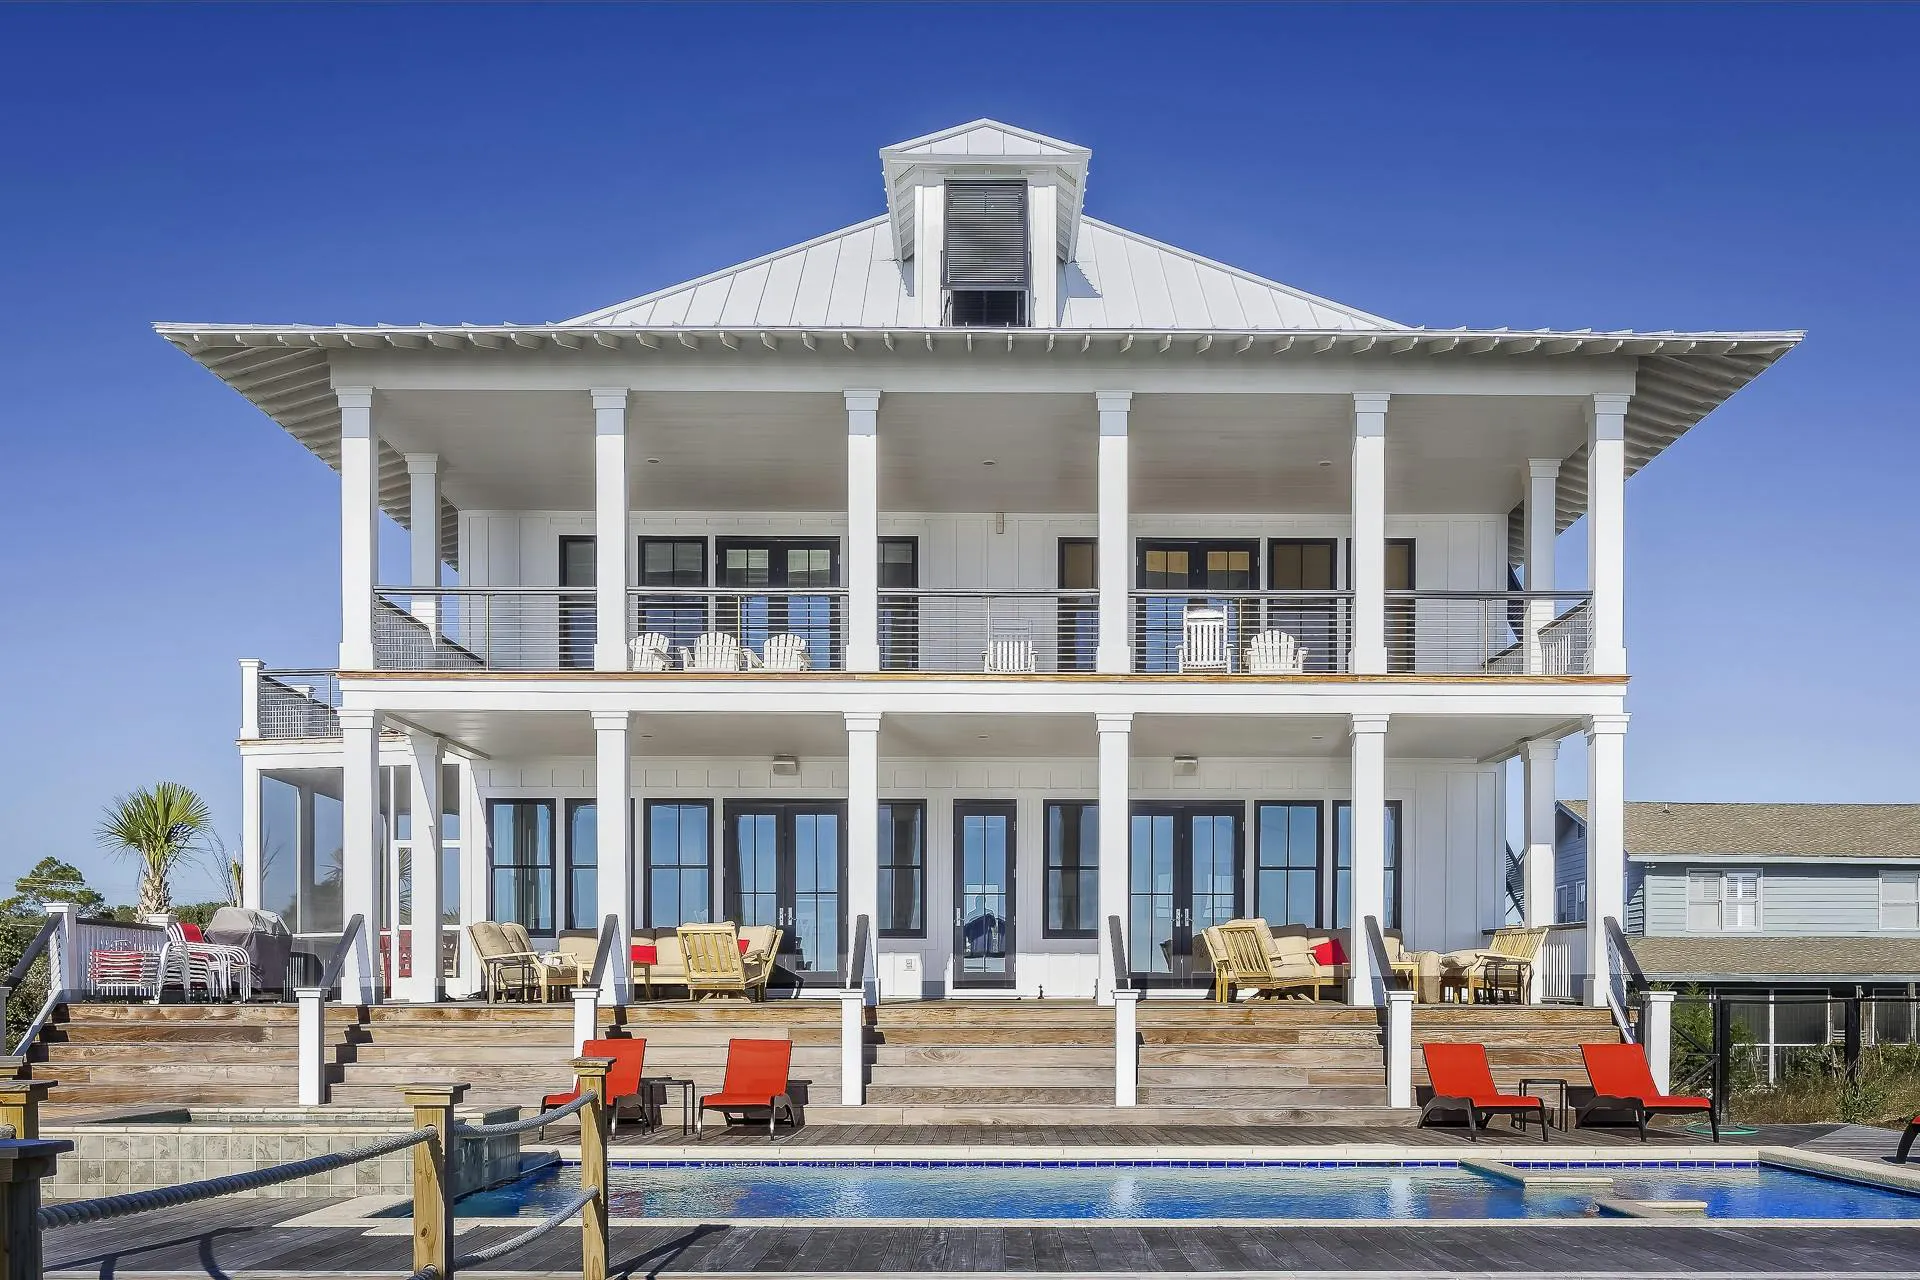

Buy where home prices make sense for you
For the second year in a row, we’re breaking down our Best Places to Invest rankings by price range, because what makes a market a good opportunity often depends on what you can actually afford.
We have grouped the highest-performing markets into six price brackets, based on the average list price of homes currently for sale in each market:
- 100-250k
- 250-400k
- 400-550k
- 550-700k
- 700k - 1M
- 1M-5M
BPTI break-outs by budget and by demand driver are ranked by yield, which tells you what percentage of the sale price is covered by your projected short-term rental earnings annually. It’s a standard real estate metric that can be used to compare how effectively properties generate revenue relative to their purchase price across different budget levels.We recommend looking at markets through this budget-focused lens if you’re an investor with limited capital or if you have a clear price range in mind.
Keep in mind that higher yields typically show up at lower price points and vice versa. It can take a large portfolio of lower priced properties with high yields to generate significant cash flow. While markets with higher prices typically have lower yields, they can generate more income per listing even at a lower return rate. With short-term rentals generally being a non-passive asset class, it can sometimes be advantageous to have fewer properties generating more profit, even if it comes at lower overall yields.
Best Places to Invest by Demand Driver


Explore markets based on the type of tourism
We introduced demand drivers as a new breakout in this year’s BPTI rankings because so much of any short-term rental investment strategy is tied to why people travel to a specific market. Demand drivers are now a Market Filter in the AirDNA app:
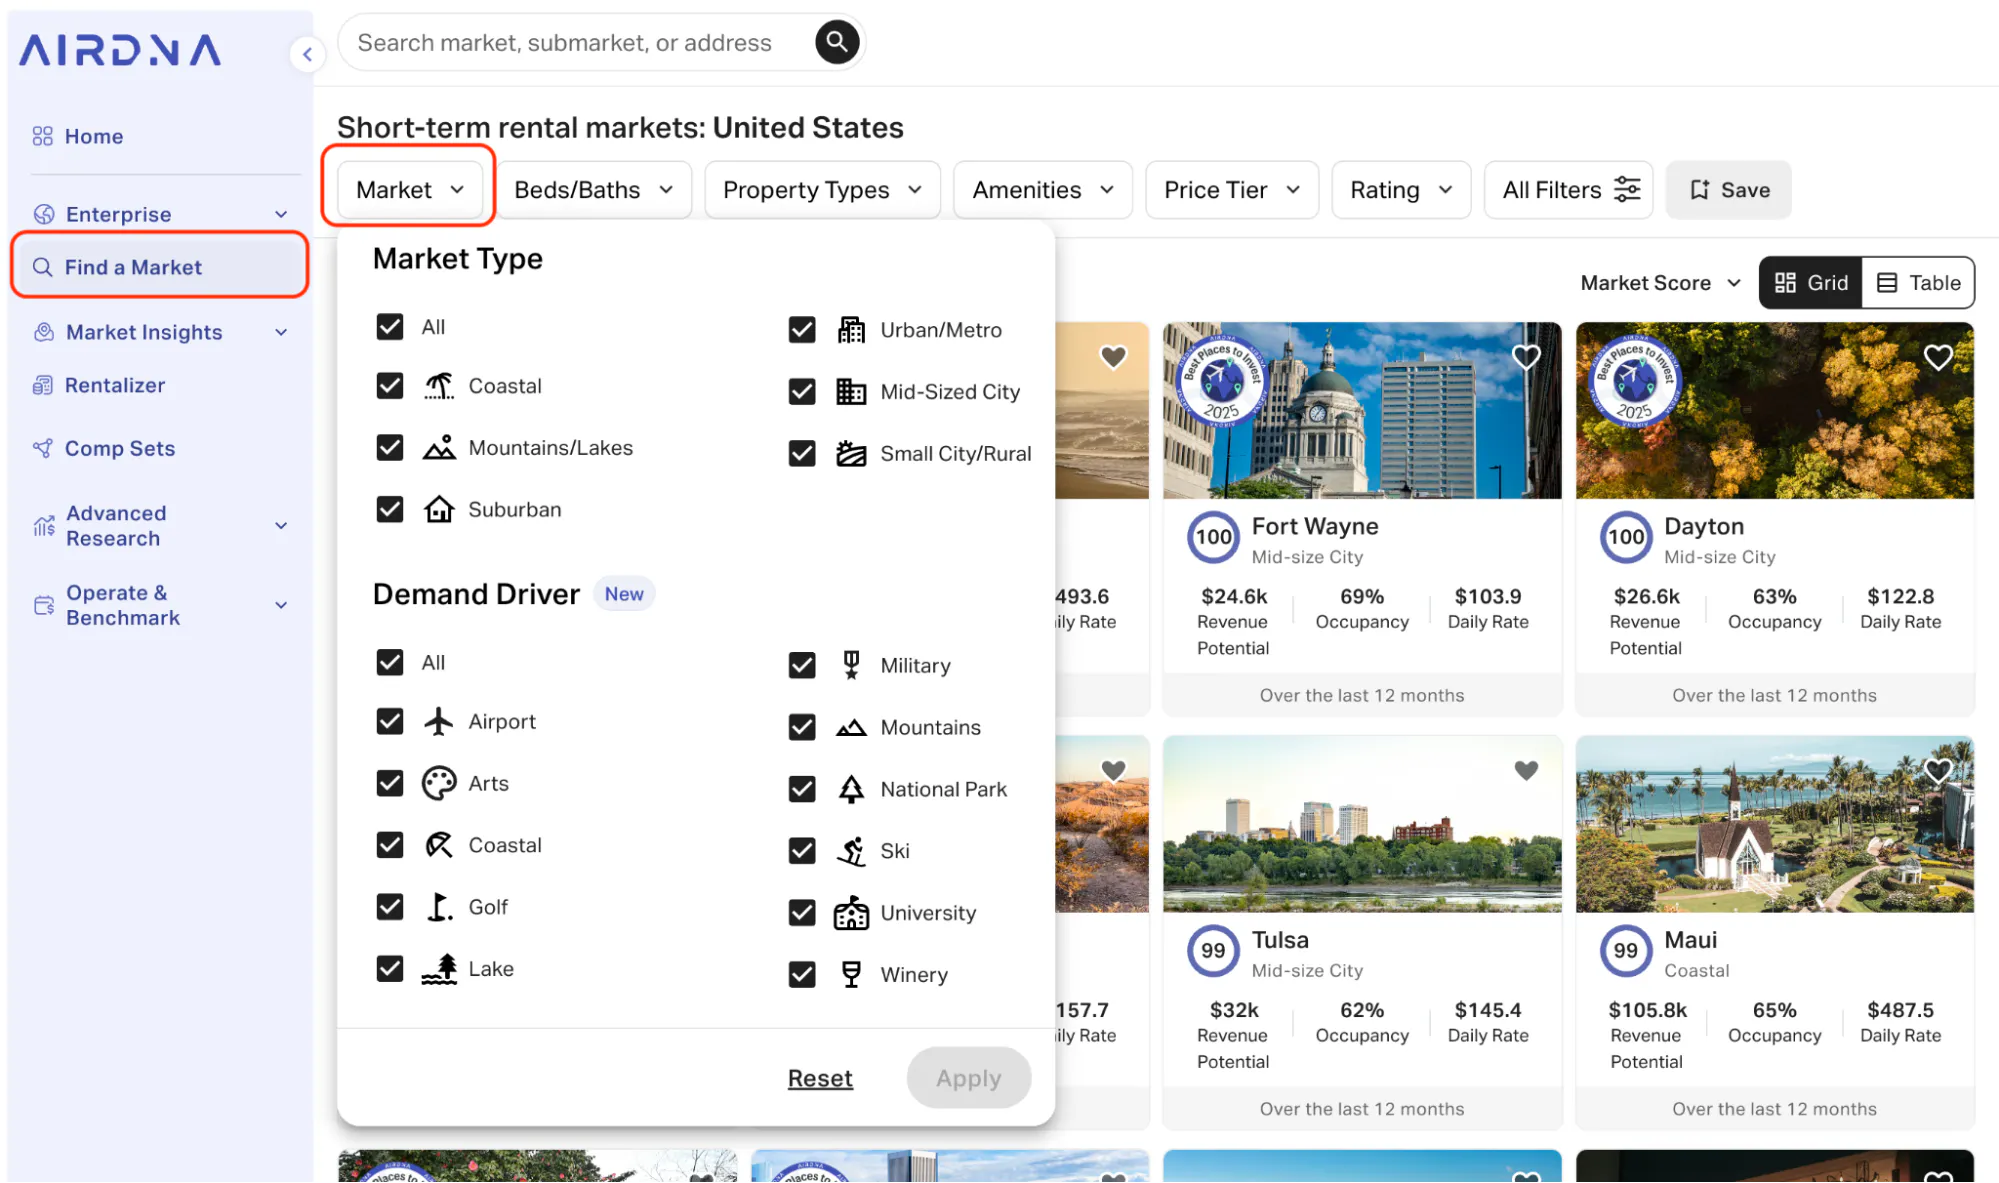
A demand driver is the local feature or attraction that gives guests a reason to visit: something like a ski resort, university, or national park. These tourist attractions don’t just influence how often people book, but also when, why, and who.
Filtering by demand driver has multiple benefits for investors. It can help surface markets where guest interest is tied to a durable source of demand. Markets with a clear demand driver make it easier as a host to plan around clear booking patterns, tailor your property to a specific audience, and market to guests with a defined purpose.
For investors who value personal use of their property, filtering by demand driver can locate markets that are profitable and offer the type of vacation experiences they enjoy. If you’re a hiker, for instance, the best places to invest in mountain towns might be a good starting point for you.
This year’s demand driver breakouts include:
- Beach/coastal
- Mountain
- Ski
- National Park
- Winery
- University
- Military
- Golf
- Arts & Culture
- Airport hubs
How to Use Best Places to Invest
Don’t let Best Places to Invest be a one-and-done read. We want to see you start or expand your Airbnb business with this report as your launching point. Here’s how to take the next steps.
Explore featured markets
Each featured location in this report includes a link to its market overview page, where you can:
- Explore active short-term rental listings to see the competition in the area.
- View properties for sale, complete with detailed performance projections.
- Dive deeper into market performance metrics, such as occupancy, revenue, and RevPAR.
- Use filters to tailor your search by bedroom count, amenities, and more.
Diving into the market overview in the AirDNA app will help you better understand the opportunities in that location and how they align with your goals.
Apply the report to other markets
This report can and should be more than a list of top airbnb markets—it's a comprehensive resource for developing your short-term rental investment strategy.
Apply our evaluation framework to markets that interest you, whether they're featured in our rankings or not. Focus on the key performance indicators we've highlighted: demand patterns, revenue growth, and overall investability. Calculate yield to compare investment potential across different locations, or study how seasonality impacts revenue in various market types. The report's methodology gives you a systematic way to conduct your own rental market analysis that matches your criteria.
Understand the bigger picture
Deciding the best place to buy Airbnb property is just the beginning of your short-term rental investment journey. Next comes finding the right property, financing the purchase, and preparing the property for Airbnb. It’s a lot to consider, but don’t worry. Whatever it is, we’ve got a guide for it.
The Top 10 Best Places to Invest in a Short-Term Rental Property
We recognize that investing isn’t one-size-fits-all, so we’ve also included a table graphic to help you compare these markets side by side. Understanding the metrics we feature is crucial for making informed decisions.

Understanding the metrics we feature is crucial for making informed decisions. Here’s a quick overview of the performance metrics included in the table and what they reveal about each market:
Here’s a quick overview of the performance metrics included in the table and what they reveal about each market.
Growth indicators
- Booked Listing Growth: Booked listing growth measures the year-over-year increase in the number of short-term rentals that received at least one booking. It’s a strong indicator of rising demand and host activity. It shows not just how many listings exist in a market, but how many are actually getting reservations.
- Gross Yield: Calculated as average annual revenue potential divided by average for-sale property price, gross yield shows how quickly an investment can pay off. Markets with higher yields typically offer stronger cash flow, making them attractive for investors seeking quick returns.
- RevPAR Growth: This reflects the year-over-year growth in revenue per available rental (RevPAR), combining the effects of ADR and occupancy. Positive changes signal improving market performance and high earning potential.
- Average Listing Price: This is the average asking price of homes currently for sale in each market. It helps set expectations around what it might cost to buy in and gives important context when comparing yield or revenue potential across different locations.
- Average Revenue Potential: This is the estimated yearly income that properties currently for sale in that market could earn as short-term rentals.
- Occupancy rate: This reflects the percentage of available nights that get booked among active listings in that market. Higher average occupancy rates mean consistent traveler demand, which is key to generating reliable revenue.
Other metrics
- Average Listing Price: This is the average asking price of homes currently for sale in each market. It helps set expectations around what it might cost to buy in and gives important context when comparing yield or revenue potential across different locations.
- ADR (Average Daily Rate): The average amount that active listings in that market earn per booked night. ADR reflects both host pricing power and traveler demand.
- RevPAR (Revenue Per Available Rental): Combining ADR and occupancy, RevPAR reflects how much you make per night, whether your place is booked or not.
1. Port Arthur, Texas


This one might surprise you (we raised our eyebrows at first, too). Port Arthur doesn’t look like a typical top-ranked Airbnb market, but it earns the #1 spot for a reason. It’s a textbook example of high-yield investing without a high price tag.
Homes here average $243,000 and generate around $35k per year, for an average yield of 14.4%. Occupancy sits near 77.6%, RevPAR is up 17% year-over-year, and booked listings have grown a massive 23% in the last year, pointing to a market where both demand and performance are still climbing.
So what’s driving those numbers? Not beachgoers or ski crowds, but industry. Port Arthur is home to the largest oil refinery in the U.S., a major shipping port, and billions in energy and infrastructure projects. Meanwhile, a new natural gas terminal is under construction, bringing in thousands of contractors, engineers, and crews. One thing they all have in common? A need for short-term housing. It’s that steady, real-world demand that keeps calendars full and income flowing year-round.
Port Arthur does still have some traditional tourism draws. Port Arthur’s coastal setting, outdoor recreation, and local food culture draw regional visitors for fishing trips, birding, and low-key family getaways. That second layer of demand helps round out the calendar and drive weekend rates.
Regulations: Port Arthur has recently formalized its approach to short-term rentals. In early 2025, the city approved an ordinance that requires STR hosts to register, obtain a permit, and remit the city’s 7% local hotel occupancy tax. The city is rolling out an online registration portal, coordinating with major platforms for tax collection, and using third-party monitoring and code enforcement to identify active rentals. For investors, that means the rules are clear and there’s a defined path to operate.
2. Abilene, Texas


Abilene doesn’t scream “vacation destination” either, and it’s not trying to. Behind its modest curb appeal is the highest-yield market in our entire 2026 rankings.
Homes here average $336,000, with an annual revenue potential of $55k. That works out to a 16.4% yield, meaning investors are earning back about one-sixth of the purchase price each year in gross income. Occupancy sits at 77.2%, and RevPAR is up 49% year-over-year, the highest growth rate on our entire list. Booked listings have climbed nearly 15% in the last year.
Jobs, healthcare, and education are driving demand in this market. Abilene is home to Dyess Air Force Base: the market’s largest employer with nearly 9,000 personnel. There’s also a cluster of colleges, including Abilene Christian University, as well as the Hendrick healthcare system. The Stargate AI infrastructure project is also a huge source of demand for short-term accommodation, as evidenced by Abilene leading all Texas cities with 28% hotel revenue growth in the first quarter of 2025.
This diversified demand is reflected in a strong 77.2% average occupancy, a rate that stays above 75% 10 months out of the year with modest lows of 50-65% occupancy during the darkest winter months.
Regulations: Abilene’s regulatory picture is mixed/uncertain. One source states that hosts must obtain a permit from the City of Abilene to operate legally, while another claims there are no specific short-term rental laws currently in place. Investors should confirm current city requirements before purchase and underwriting. The City of Abilene government website is a great place to start.
3. Downtown Saint Paul (Minneapolis, Minnesota)


Not all big-city investments are out of reach. Downtown Saint Paul offers major metro demand without the seven-figure price tags. It’s one of the few urban cores where the numbers still work, and where buyers have real inventory to choose from. There are 165 homes for sale as of December 2025 .
Homes here average $331,000, with $45k in annual revenue potential and an average 13.5% yield. This is a standout profile for an urban neighborhood in one of the top Airbnb markets in the Midwest. Occupancy averages 64.1%, RevPAR is up 10% year-over-year, and booked listings have grown 5.4% in the last year, suggesting a market where demand is healthy and performance is still improving rather than flattening out. With around 740 active STR listings, this is a proven market, not an experiment.
As the capital of Minnesota, Downtown Saint Paul draws legislators, lobbyists, and government staff throughout the year. Major employers like Ecolab and Securian Financial attract business travelers, while Regions and United hospitals bring in medical guests. The Xcel Energy Center and RiverCentre convention complex keep the calendar filled with concerts, hockey games, and large-scale events. These drivers make short-term rentals viable even outside traditional vacation seasons.
Cultural and leisure appeal adds a second layer of demand: think the Science Museum of Minnesota, the Cathedral of Saint Paul, historic architecture, and a walkable downtown full of restaurants and local events. Many travelers also stay here while exploring the wider Twin Cities, thanks to Saint Paul’s easy access to Minneapolis.
Regulations: Overall, the regulatory environment is structured but workable: Saint Paul requires a Short-Term Rental Host License, and the city notes that buildings may exceed four short-term rental dwelling units only if the building owner obtains a conditional use permit. Short-term rental registration requires a management plan, liability insurance, neighbor notification, and a unit floor plan. Investors should plan for compliance steps, but the framework is clear enough to underwrite.
4. Charleston, West Virginia


Charleston, West Virginia delivers something rare even among our top picks: one of the lowest buy-in prices paired with one of the highest yields.
Homes here average just $228,000, with annual revenue potential around $32k. That translates to a 14.1% gross yield, meaning investors can start generating meaningful cash flow without betting on luxury rates or peak-season spikes. In a market where bookings are steady and costs are manageable, that math can go a long way.
Occupancy averages 62.9%, and RevPAR is up 15% over last year, with booked listings rising by 9.6% over the same time period. With 309 active listings and 164 homes currently for sale as of December 2025, there’s also a solid mix of inventory for both guests and investors.
Guest demand comes from a broad mix of travelers. As the state capital and largest city in West Virginia, Charleston sees steady traffic from government employees and travelers attending events at the downtown civic center. The Charleston Area Medical Center (CAMC) is the state’s largest hospital and employs over 5,000 people, drawing patients and specialists from across the region. Charleston also retains a “Chemical Valley” industrial legacy, which means engineers and workers frequently travel to the several chemical plants and energy companies in the area.
Charleston is a reminder that not every high-performing market comes with high-stakes risk. If your strategy is about balance, which means low acquisition costs, decent volume, and the ability to run lean, then this market delivers.
Regulations: West Virginia does not currently require a statewide short-term rental license, but all hosts must collect and remit state sales tax and possibly local occupancy taxes, depending on the area. Charleston’s specific regulations may include business registration, zoning compliance, and adherence to health and safety codes, but there’s no centralized citywide STR ordinance at this time. Investors should confirm current local requirements with the City of Charleston before buying or listing a property.
5. Springfield, Illinois


For investors looking for reliable returns without the noise, Springfield is a great choice. It’s on our list the second time in a row for a reason!
Homes here average $262,000 with an annual revenue potential around $35k. The result is a 13.2% gross yield, which is right in line with the average for our Top 10. What’s more interesting is the market’s consistency: occupancy sits at 66.0%, RevPAR is up 8% year-over-year, and booked listings have climbed 17% between 2024 and 2025. Guest demand and host participation are gaining real ground. Plus, with 164 homes currently for sale as of December 2025, Springfield offers a decent-sized pool of options in a price bracket that many investors can still enter.
As the capital of Illinois and the longtime home of Abraham Lincoln, Springfield draws steady demand from government-related travel, heritage tourism, regional events, and educational trips. It’s a civic and cultural hub that sees reliable, year-round bookings. Plus, Springfield hosts the Illinois State Fair each year, an event that drew over 1 million attendees in 2025, a huge influx of visitors for an otherwise “non-touristy” city.
Regulations: Illinois does not require a statewide license specifically for short-term rentals, but all hosts must register with the state to collect and remit the Hotel Operators’ Occupation Tax to the Illinois Department of Revenue. Local rules often apply as well. While platforms like Airbnb may handle some tax collection, hosts are still responsible for ensuring all state and local taxes are properly reported and paid. Confirm Springfield’s current requirements before buying or listing a property.
AirDNA is where smart investors start.
Make confident investment decisions with industry-leading data and actionable insights.
6. Lake Charles, Louisiana


Lake Charles, Louisiana offers steady, reliable growth driven by energy industry activity and a bustling port. RevPAR is up 9% year-over-year and booked listings have grown 7% over the same time period. Only 41 homes are currently for sale as of December 2025, so new supply is limited. That balance of momentum and scarcity makes it a compelling choice for investors looking to enter a proven market with limited competition from other new entrants.
Homes here average $287,000, with revenue potential around $37k per year. That works out to a 12.7% gross yield, which is strong performance at a price point that’s still accessible. Occupancy averages 60.6%, pointing to a stable demand base with room to optimize. With 690 active listings, it’s also a large enough market to support both hands-on hosts and professional managers.
Guest demand is driven by a mix of petrochemical and LNG workforce travel, regional events, and infrastructure projects. The Port of Lake Charles, one of the nation’s busiest ports by tonnage, along with the large aviation maintenance hub at Chennault Airpark, contributes a steady stream of business travelers. Lake Charles enjoys strong year-round rental demand fueled by its status as an energy corridor rather than a vacation spot.
Regulations: Lake Charles requires short-term rental hosts to register with the city and obtain an occupational license. Properties must comply with zoning requirements and are subject to hotel occupancy taxes. As with most Louisiana cities, the regulatory environment is locally defined, so investors should review the City of Lake Charles Planning & Development page or contact local officials for up-to-date rules and compliance requirements.
7. Montgomery, Alabama


Montgomery isn’t the most expensive market on our list, but it does sit at the higher end, with an average home price of $342,000.
So is the higher buy-in worth it?
In this case, yes. With a perfect 100 Market Score, properties here still deliver a 12.2% average yield, with annual revenue potential around $42k. That combination is what makes Montgomery interesting: it shows that investors don’t always have to choose between affordability and strong returns. A slightly bigger upfront investment can still pay off, as long as the revenue supports it.
Occupancy averages 62.6%, RevPAR is up 9% year-over-year, and the market has over 640 active listings. That’s enough to prove demand is there without being oversaturated. Booked listings have grown more modestly (up 2.6% year-over-year), which suggests a steady market rather than a surging one. Montgomery isn’t a “hot” pick in the trend-driven sense. It’s a stable, proven city where short-term rental demand is driven by a mix of government, healthcare, education, and regional travel.
Regulations: Montgomery, Alabama currently has a relatively light-touch regulatory environment for short-term rentals. Hosts are required to obtain a standard business license from the city, and all operators must collect and remit local and state lodging taxes. These taxes include Alabama’s state lodging tax, a city transient room tax (~11%), and any applicable county fees.
There’s no dedicated STR ordinance, no primary-residence requirement, and no cap on the number of nights you can rent annually, which creates a fairly straightforward path to operation, especially compared to many urban markets. However, the Montgomery City Council has discussed future oversight, including possible neighborhood caps or operating limits, so stay informed.
8. Akron, Ohio


Akron is a returner from last year’s BPTI rankings, where it sat at number 3. It has more active short-term rentals than any other market in our Top 10 for 2026, with 757 short-term rental listings and climbing. That’s a signal demand is steady, regulation is manageable, and the math still works for operators despite more investors entering the market.
For-sale homes here average $297,000 and number in the thousands, with revenue potential of around $39k per year. That pencils out to a 13.1% gross yield, leaving plenty of cushion for expenses, upgrades, or flexible pricing strategies. Occupancy averages 62.4%, and booked listings are up nearly 18% year-over-year, pointing to a market with real momentum. RevPAR has also grown by 7% over the same time period, reinforcing the trend.
Akron’s demand comes from a mix of sources: it’s right outside of Cuyahoga Valley National Park and home to three major hospital systems, several universities, and multiple company headquarters (Goodyear Tire & Rubber and Purell hand sanitizer manufacturer, Gojo Industries, to name a few).
Add in regional events, youth sports, and summer festivals, and you’ve got a market that supports bookings across weekdays and weekends. Its proximity to Cleveland gives it extra versatility. Some guests use it as a base to explore Northeast Ohio at a more affordable rate.
Regulations: Akron has implemented a short-term rental ordinance that requires hosts to register with the city, pay an annual fee, and follow local health and safety standards. Hosts are also required to collect a local lodging tax. You can find more details directly from the City of Akron. Overall, it’s a defined but navigable environment for operators.
9. Lebanon, Pennsylvania
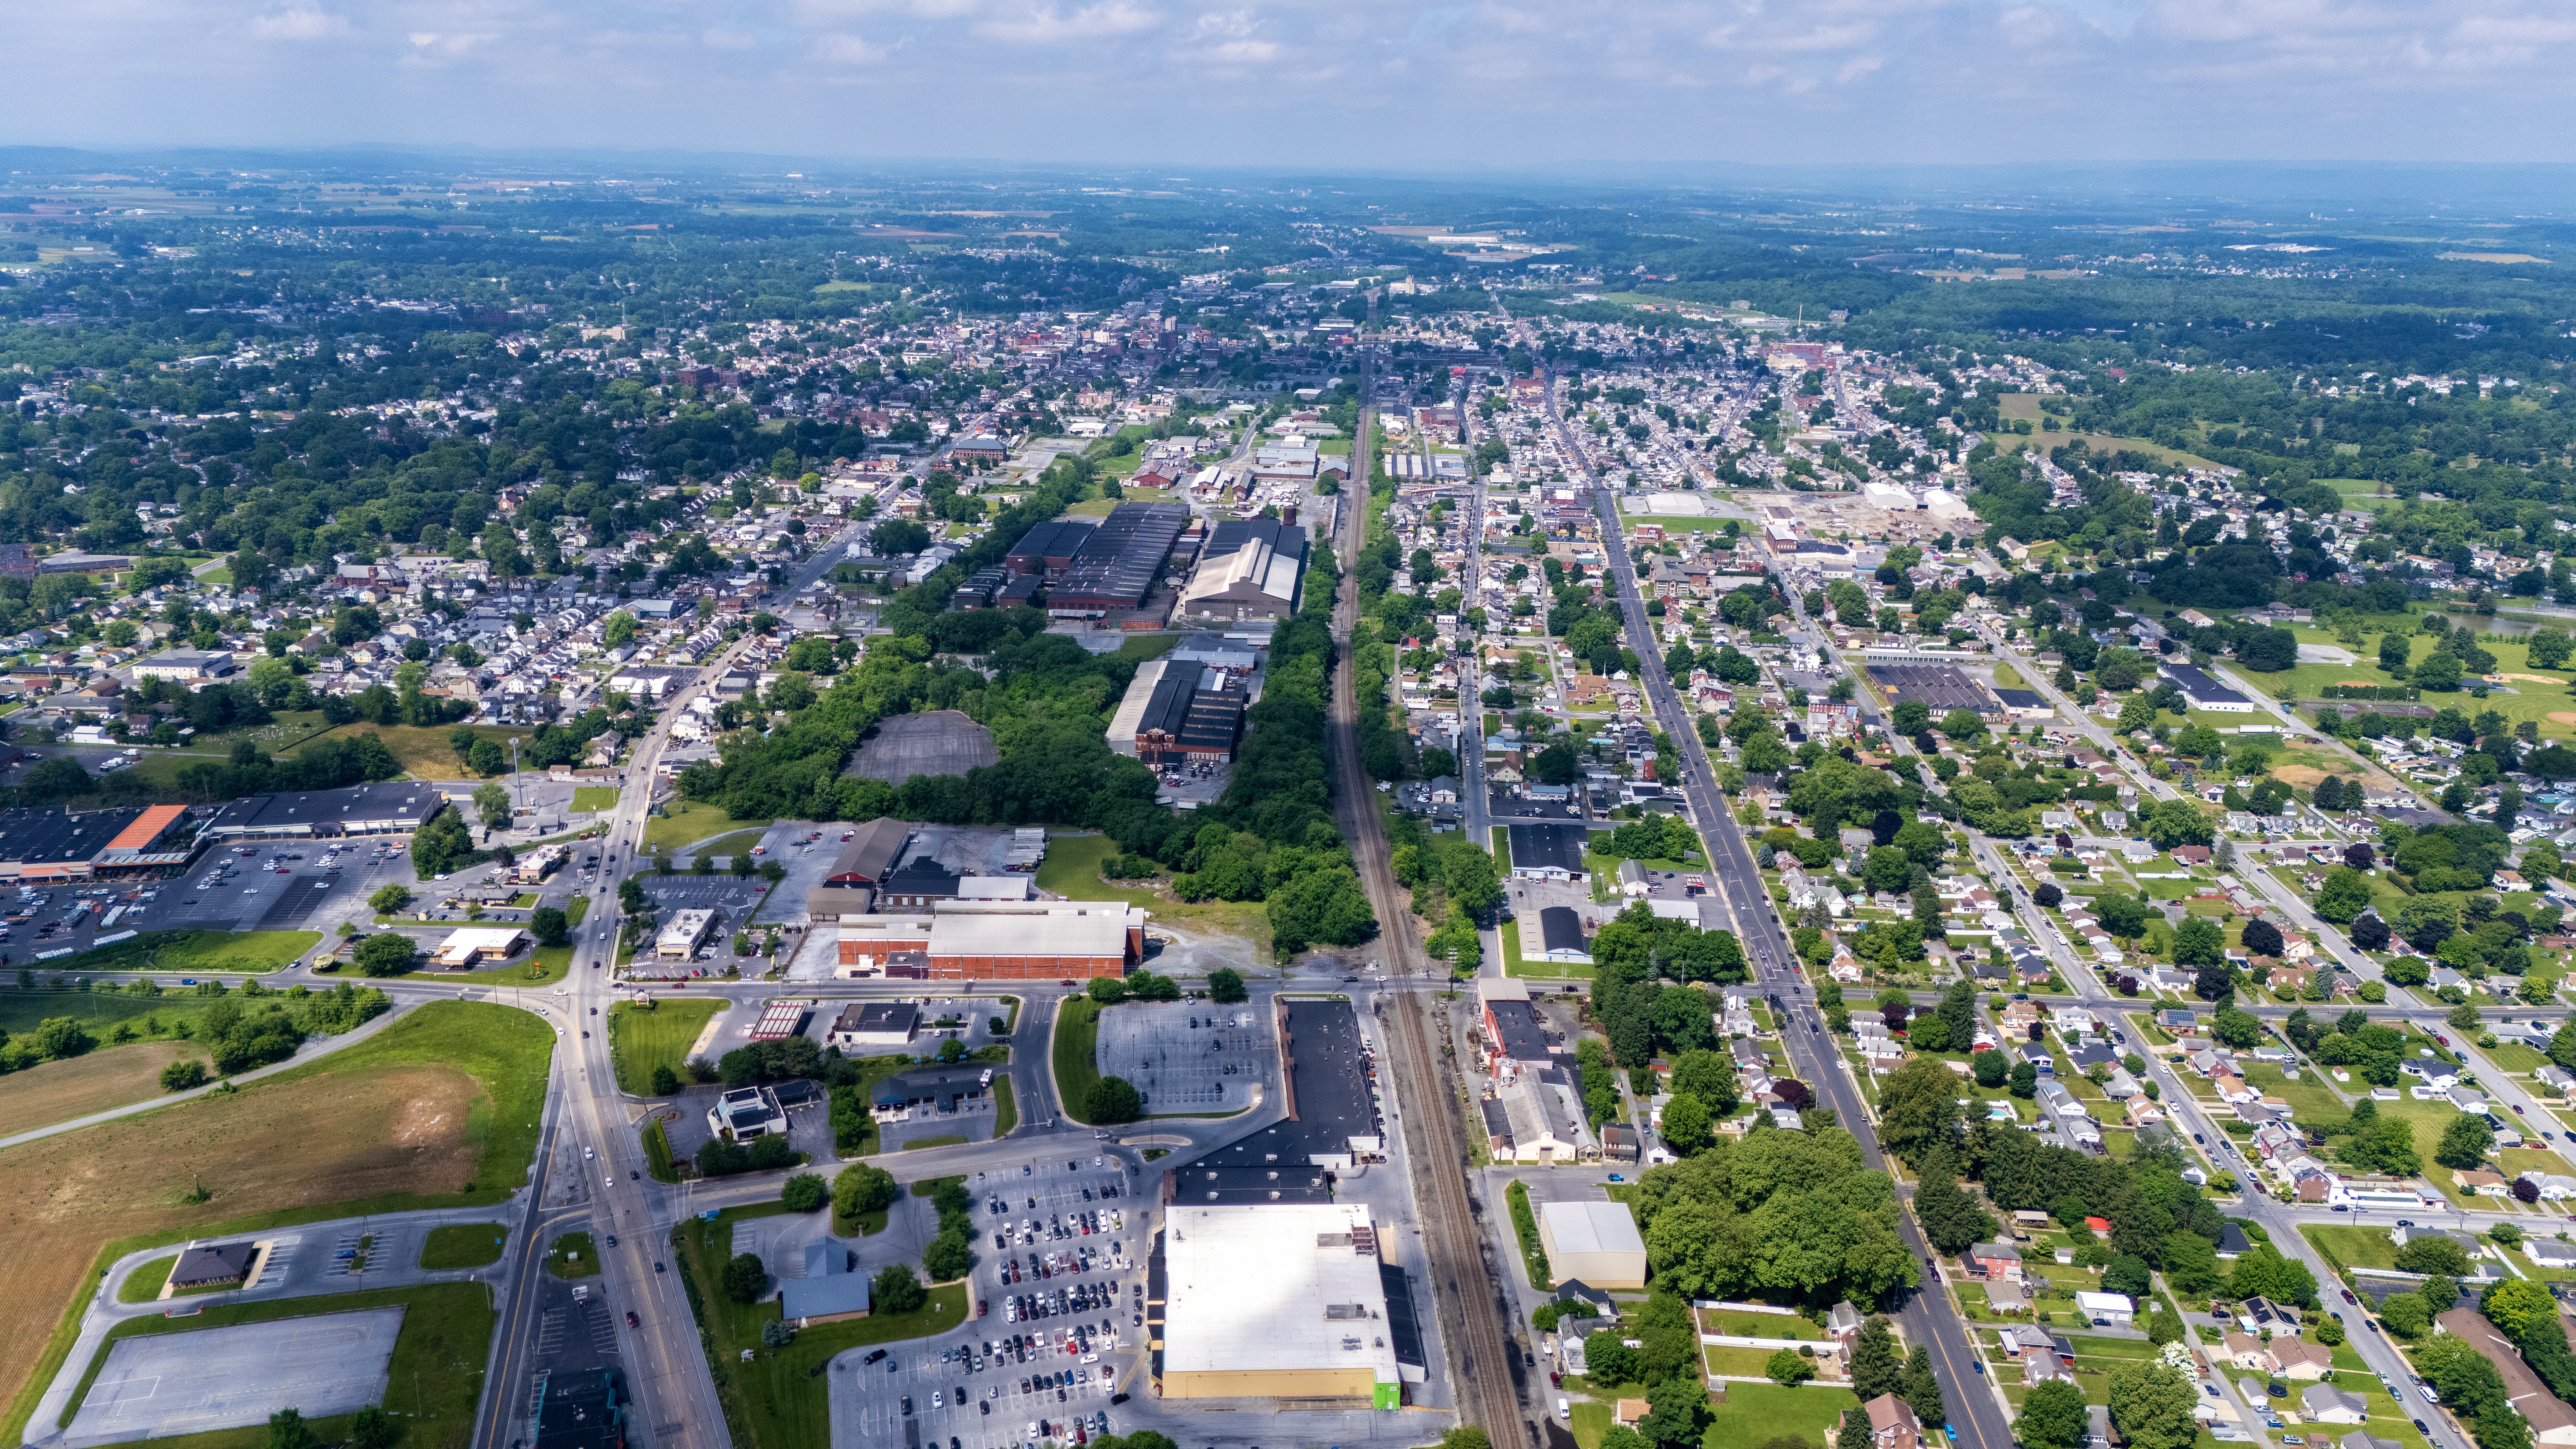

In a region known for high prices and heavy competition, Lebanon stands out for doing more with less. It’s rare to find a Northeast market where $265K gets you in the door and still delivers 15.7% gross yield, but that’s exactly the case here. For investors who want strong revenue without battling over luxury properties or outbidding second-home buyers, Lebanon offers a smarter path in.
Located just between Hershey and Lancaster, Lebanon picks up consistent travel demand from guests who want to experience Central Pennsylvania’s attractions without paying premium rates for lodging in the headline cities. It’s a go-to base for families, weekenders, and outdoor travelers visiting the region’s trails, parks, and small-town attractions.
Fort Indiantown Gap, one of the nation’s busiest National Guard training centers, is also located nearby. The base’s military mission annually supports around 20,000 Guard personnel plus over 120,000 other trainees from various branches and agencies. This is a massive throughput that fuels demand for short-term lodging in the area.
Revenue potential averages almost $42K per year, occupancy holds steady at 59.2%, and RevPAR has climbed 10% year-over-year, clear signs of a market with real staying power.
Regulations: The City of Lebanon requires all residential rental units to be registered with the Department of Public Safety. That includes short-term rentals, which are expected to comply with basic safety and licensing standards. The process is straightforward, but investors should check local guidelines to ensure full compliance.
10. Jackson, Mississippi


Among our top 10 markets, Jackson has the highest average home price at $366,000 but still manages to turn out an impressive 11.9% gross yield and $44k for average revenue potential. In most markets at this price point, margins tend to thin. In Jackson, they hold up, suggesting a strong enough base of demand to support both healthy rates and reliable occupancy.
Jackson’s performance trend is moving in the right direction. Occupancy averages 64.4%, RevPAR is up 15% year-over-year, and booked listings have increased by 11.6% over the same time period. As the state capital, it benefits from government travel and events year-round.
Major institutions like the University of Mississippi Medical Center and Jackson State University likely add a layer of medical and education-related bookings, while the Jackson Convention Complex brings in midweek demand from trade shows and civic events. Cultural attractions like the Mississippi Civil Rights Museum and Children’s Museum round things out on the leisure side, helping fill weekends and school breaks.
Regulations: Jackson requires a permit to operate a short-term rental, and zoning restrictions may limit STRs to certain areas. Hosts may also need a business license and must comply with city lodging tax rules. The environment is moderately regulated. Check the City of Jackson website for the latest regulations.
See short-term rental properties for sale
View the earning potential of real homes that are listed for sale.
FAQs
What are the best Airbnb markets in 2026?
The best Airbnb markets in 2026 aren’t all beach towns or ski resorts rooted in vacation tourism. Rather, they’re markets with diversified demand from government, education, workforce, and medical travel. Places like Abilene, Texas and Lebanon, Pennsylvania are showing some of the strongest yields and cash-flow potential anywhere in the country. AirDNA’s latest Best Places to Invest list highlights 10 U.S. markets where short-term rental numbers actually work and where there’s room to buy smart.
How did you create the Best Places to Invest list?
The rankings are based on the proprietary BPTI Score, which measures three critical factors:
- Rental demand: The frequency of bookings in each market.
- Revenue growth: Metrics like RevPAR and ADR that track market performance.
- Investability: Compares current home prices with annual revenue potential to determine return on investment (ROI).
This methodology focuses on identifying today’s most lucrative opportunities for investors, ensuring the rankings reflect both current trends and future potential.
How can I use the Best Places to Invest report?
You can use the report to:
- Identify top-performing markets: Evaluate destinations with high growth, profitability, and demand.
- Refine your investment strategy: Find markets tailored to your budget and investment goals.
- Dive deeper into market specifics: Access detailed pages with performance data, active listings, and filters for features like bedroom count or amenities.
Can this report help with local markets?
Yes. Even if your target market isn’t listed, the methodology provides a framework for evaluating other profitable markets that are more local to you. Compare metrics like occupancy, ADR, and RevPAR in your preferred area to assess its investment potential.
What should I do after reading this report?
If a market catches your eye:
- Visit the market overview page for detailed insights and active listings.
- Use AirDNA’s investing tools to analyze investment locations and our Airbnb Revenue calculator to assess individual properties.
- Check out our blog for expert advice on financing, investment strategies, and maximizing short-term rental performance.
For a complete overview of the Best Airbnb Markets 2026, explore the full report and start planning your next investment.
